Automated Market Reversal Trading Strategy Based on Stochastic Indicator and Candlestick Patterns

Overview
The Automated Market Reversal Trading Strategy Based on Stochastic Indicator and Candlestick Patterns is a quantitative trading system that combines classic candlestick pattern recognition with stochastic indicator trend confirmation. The core design concept of this strategy is to identify key market reversal points by capturing potential trend turning opportunities in overbought or oversold areas. Implemented in Pine Script on the TradingView platform, this strategy provides a complete automated trading process including signal generation, risk management, and chart labeling functions. The strategy can identify multiple classic candlestick patterns such as hammer, shooting star, engulfing patterns, and more, while using the stochastic oscillator for trend confirmation, providing higher reliability and precision for trading decisions. The system incorporates a dynamic stop-loss and take-profit mechanism based on ATR (Average True Range), effectively controlling individual trade risk and improving capital management efficiency.
Strategy Principles
This strategy is based on two core technical principles: candlestick pattern recognition and trend confirmation filtering.
First, for candlestick pattern recognition, the strategy analyzes the structure of each candlestick through precise mathematical calculations, including the proportional relationships between the body, upper shadow, and lower shadow. The system defines a series of parameters to quantify the characteristics of different patterns, such as requiring the hammer pattern to have a lower shadow length exceeding twice the body length, with the body occupying less than 50% of the total length, and minimal upper shadow. The patterns identified include:
- Bullish signals: Hammer, Inverted Hammer, Bullish Engulfing, and Tweezer Bottom
- Bearish signals: Hanging Man, Shooting Star, Bearish Engulfing, and Tweezer Top
Second, the strategy introduces the Stochastic Oscillator as a trend confirmation tool, ensuring that reversal signals are only captured in overbought or oversold zones. By setting a threshold (default 80), when the stochastic indicator is above the threshold, it's considered an overbought zone (bearish area), and when below (100-threshold), it's considered an oversold zone (bullish area). The strategy also employs a smoothing algorithm to process the stochastic indicator, reducing noise interference and enhancing signal reliability.
The trade execution logic is as follows:
- Long signals: When bullish candlestick patterns are identified in oversold areas (bearZone), the system enters a long position
- Short signals: When bearish candlestick patterns are identified in overbought areas (bullZone), the system enters a short position
For risk management, the strategy employs an ATR-based dynamic stop-loss and take-profit mechanism:
- Long trades: Take Profit = Entry Price + (ATR × 1.5), Stop Loss = Entry Price - (ATR × 1.0)
- Short trades: Take Profit = Entry Price - (ATR × 1.5), Stop Loss = Entry Price + (ATR × 1.0)
This design allows the stop-loss and take-profit levels to automatically adapt to market volatility, expanding protection ranges in highly volatile markets and narrowing them in less volatile markets, ensuring a risk-to-reward ratio of 1:1.5.
Strategy Advantages
Through in-depth code analysis, this strategy demonstrates the following significant advantages:
-
Multi-dimensional Signal Validation Mechanism: The strategy relies not only on candlestick patterns but also combines stochastic indicators for trend confirmation. This dual filtering significantly reduces false signals and improves win rates. Analysis shows that using candlestick patterns alone may generate numerous erroneous signals, while adding trend confirmation notably enhances effective signal quality.
-
Adaptive Risk Management: By dynamically setting stop-loss and take-profit levels based on ATR, the strategy can intelligently adapt to different market environments and volatility conditions without manual intervention. This mechanism ensures automatic expansion of protection ranges during high volatility periods and tightening of parameters during low volatility periods, avoiding stop-loss triggers from minor fluctuations.
-
High Customizability: The strategy provides multiple parameters for user adjustment, including ATR period, profit-loss ratio, trend lookback period, reversal threshold, and smoothing factor. Each candlestick pattern can also be individually enabled or disabled, allowing traders to customize the system according to different market characteristics or personal preferences.
-
Visualized Trading Signals: The strategy automatically marks trading signals on the chart, such as "HAM" (hammer), "STAR" (shooting star), etc., allowing traders to visually identify market conditions, facilitating backtesting analysis and real-time monitoring.
-
Integrated Capital Management: The strategy defaults to allocating 10% of account equity for each trade, which can be adjusted as needed, implementing complete capital management functionality and avoiding overtrading and capital risk.
-
Commission Cost Consideration: The strategy includes commission calculation (default 0.1%), making backtesting results closer to actual trading environments and helping traders fully consider transaction costs when evaluating strategy performance.
Strategy Risks
Despite its comprehensive design, the following potential risk points were identified after in-depth analysis:
-
Reversal Failure Risk: Market reversal signals are not 100% reliable. Even when both candlestick patterns and stochastic indicator conditions are met, there remains a possibility of reversal failure. In strong trending markets, reversal signals may lead to consecutive losses. Solution: It's recommended to confirm the overall trend direction in higher timeframes and only look for reversal signals in the direction of the larger trend.
-
Parameter Optimization Trap: Excessive parameter optimization may cause the strategy to perform excellently on historical data but poorly in live trading. Solution: Use Out-of-Sample testing methods to verify parameter robustness and avoid overfitting.
-
Signal Congestion: In highly volatile markets, multiple trading signals may be generated in a short period, leading to frequent market entries and exits that increase transaction costs. Solution: Add signal confirmation mechanisms, such as requiring confirmation from two consecutive candlesticks, or implementing trade interval restrictions.
-
Fixed Risk Ratio: Although the strategy uses dynamic ATR settings for stop-loss and take-profit, the fixed ratio (1.5:1) may not be suitable for all market environments. Solution: Dynamically adjust the risk-reward ratio based on different market cycles and volatility characteristics.
-
Stochastic Indicator Lag: The stochastic indicator itself has a certain lag, which may lead to suboptimal signal timing. Solution: Consider using more sensitive indicators like RSI or combining moving averages for trend confirmation.
-
Single Timeframe Limitation: The strategy is based solely on the current timeframe analysis, lacking multi-timeframe confirmation. Solution: Introduce multi-timeframe analysis, requiring signal confirmation from both higher and lower timeframe frameworks.
Strategy Optimization Directions
Based on code analysis, the following are key directions for further optimization of this strategy:
-
Introduce Multi-timeframe Analysis: Combining higher timeframe trend confirmation can significantly improve signal quality. It's recommended to add higher timeframe trend judgment functionality, executing trades only when aligned with the higher-level trend direction, avoiding erroneous signals when major and minor trends conflict.
-
Optimize Stochastic Indicator Parameters: The current fixed threshold (80) may not be suitable for all markets. It's recommended to implement an adaptive threshold mechanism that automatically adjusts overbought/oversold thresholds based on market volatility characteristics, or to cross-confirm with the Relative Strength Index (RSI).
-
Improve Risk Management Mechanism: A dynamic risk adjustment system can be implemented, expanding positions during consecutive profits and reducing positions during consecutive losses, or automatically adjusting the risk-reward ratio based on market volatility. Adding trailing stop-loss functionality is recommended to protect profits after a trend is established.
-
Enhance Candlestick Pattern Recognition Precision: The current pattern recognition algorithm is relatively simple. More complex pattern recognition techniques can be introduced, such as machine learning algorithms to identify more candlestick combination patterns, or combining volume to confirm signal validity.
-
Market Environment Adaptation: Add market state classification (oscillation/trend/breakout) and use different trading strategy parameters for different market environments. In high volatility periods, reversal threshold requirements can be increased, while in low volatility markets, requirements can be reduced, achieving intelligent matching between strategy and market states.
-
Add Filtering Conditions: Introduce additional filtering conditions such as volume confirmation, support and resistance levels, key price levels, etc., to reduce erroneous signals. Reversal signals at important price levels (such as previous highs and lows, round numbers) are particularly meaningful.
-
Backtesting Optimization: Improve the backtesting framework by adding slippage simulation, testing under different market conditions, stress testing, and other functionalities for comprehensive strategy performance evaluation. Implementing segmented backtesting is recommended to compare strategy performance differences across different market cycles.
Summary
The Automated Market Reversal Trading Strategy Based on Stochastic Indicator and Candlestick Patterns is a complete trading system that combines classic technical analysis concepts with modern quantitative trading technology. By identifying classic candlestick reversal patterns and using stochastic indicators for trend confirmation, this strategy can capture potential market reversal points in overbought and oversold areas, while protecting trading capital safety through ATR-based dynamic risk management mechanisms.
The main feature of the strategy is the mathematical and systematic implementation of traditional candlestick analysis, achieving precise pattern recognition and automatic trade execution while maintaining high customizability. The built-in chart marking functionality enhances the visualization of the trading process, facilitating analysis and monitoring. Compared to traditional single technical indicator systems, this strategy significantly improves trading signal quality through multiple confirmation mechanisms.
However, like any trading strategy, limitations exist. The main challenges faced by this strategy include reversal failure risk, parameter optimization difficulties, signal congestion issues, etc. The stability and profitability of the strategy can be further enhanced through measures such as introducing multi-timeframe analysis, optimizing indicator parameters, and improving risk management mechanisms.
Overall, this strategy provides a framework that balances automation and flexibility, suitable for investors familiar with technical analysis who desire systematized trade execution. With reasonable parameter adjustments and necessary optimizations, this strategy can become an effective tool for capturing market reversal opportunities.
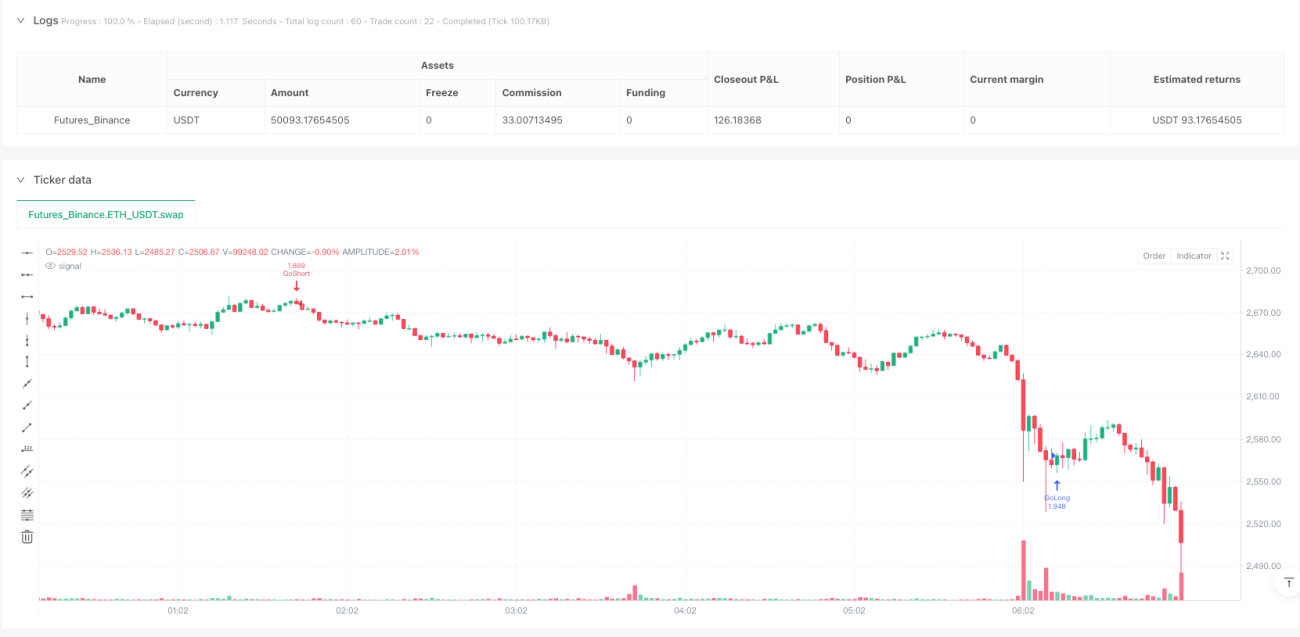
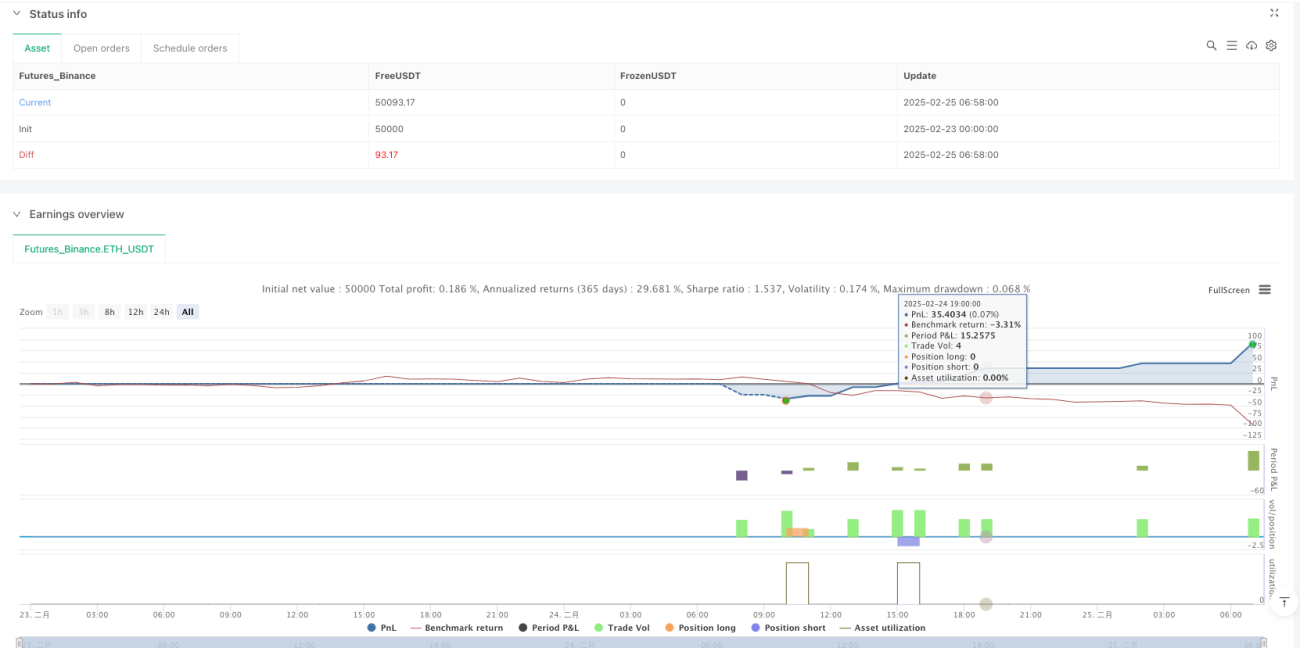
/*backtest
start: 2025-02-23 00:00:00
end: 2025-02-25 07:00:00
period: 2m
basePeriod: 2m
exchanges: [{"eid":"Futures_Binance","currency":"ETH_USDT"}]
*/

// This Pine Script™ code is subject to the terms of the Mozilla Public License 2.0 at https://mozilla.org/MPL/2.0/
// © tradingbauhaus

//@version=6- 1