
Overview
The Multi-Moving Average Trend Capture and Crossover Confirmation Trading System is a quantitative trading strategy based on a combination of multiple exponential moving averages (EMAs) of different periods, complemented by auxiliary indicators including Relative Strength Index (RSI), Moving Average Convergence Divergence (MACD), and Average True Range (ATR). The core of this strategy lies in determining market trend direction by comparing the relative positions of moving averages across different timeframes, entering positions when trends are clearly established, and exiting when trends weaken or reverse. The strategy features a specially designed multi-period trend confirmation mechanism that assesses trend strength and sustainability through the relative positions of short-term averages against medium and long-term averages, thereby improving win rates and stability.
Strategy Principles
The core principle of this strategy is to utilize multiple exponential moving averages (EMAs) of different periods to identify market trends and capture trading opportunities. The strategy employs five EMAs: instant average (14 periods), intermediate average (25 periods), short-term average (50 periods), medium-term average (100 periods), and long-term average (200 periods).
The main logic of the strategy is as follows:
-
Trend Determination Mechanism:
- Uptrend conditions: Instant EMA above short-term, medium-term, and long-term EMAs, with short-term EMA above medium-term EMA
- Downtrend conditions: Instant EMA below short-term, medium-term, and long-term EMAs, with short-term EMA below long-term EMA
-
Entry Signals:
- Long entry: When uptrend conditions are met and no position is currently open
- Short entry: When downtrend conditions are met, no position is currently open, and minimum ATR conditions are satisfied (sufficient market volatility)
-
Exit Signals:
- Long exit: When the instant EMA crosses below the short-term EMA
- Short exit: When the instant EMA crosses above the medium-term EMA
-
Risk Control:
- Uses the ATR indicator as a volatility filter, only executing short trades when volatility is sufficient (ATR greater than its average)
- Integrates RSI overbought and oversold levels as potential additional filters (though defined in the code but not currently utilized in the trading logic)
-
Position Tracking:
- The strategy uses boolean variables to track whether a position is currently open and the direction of the position (long or short)
Strategy Advantages
-
Multiple Moving Average Confirmation: By using multiple moving averages of different periods to jointly confirm trends, the strategy reduces false breakouts and erroneous signals, improving signal quality.
-
Precise Trend Identification: Compared to single moving average systems, multiple moving average systems can more accurately identify market trend turning points, especially when the relative position of the instant average changes in relation to other averages.
-
Flexible Risk Management: Different entry and exit criteria are applied to long and short positions, reflecting differentiated handling of risks in different market directions, with short trades requiring additional volatility filtering.
-
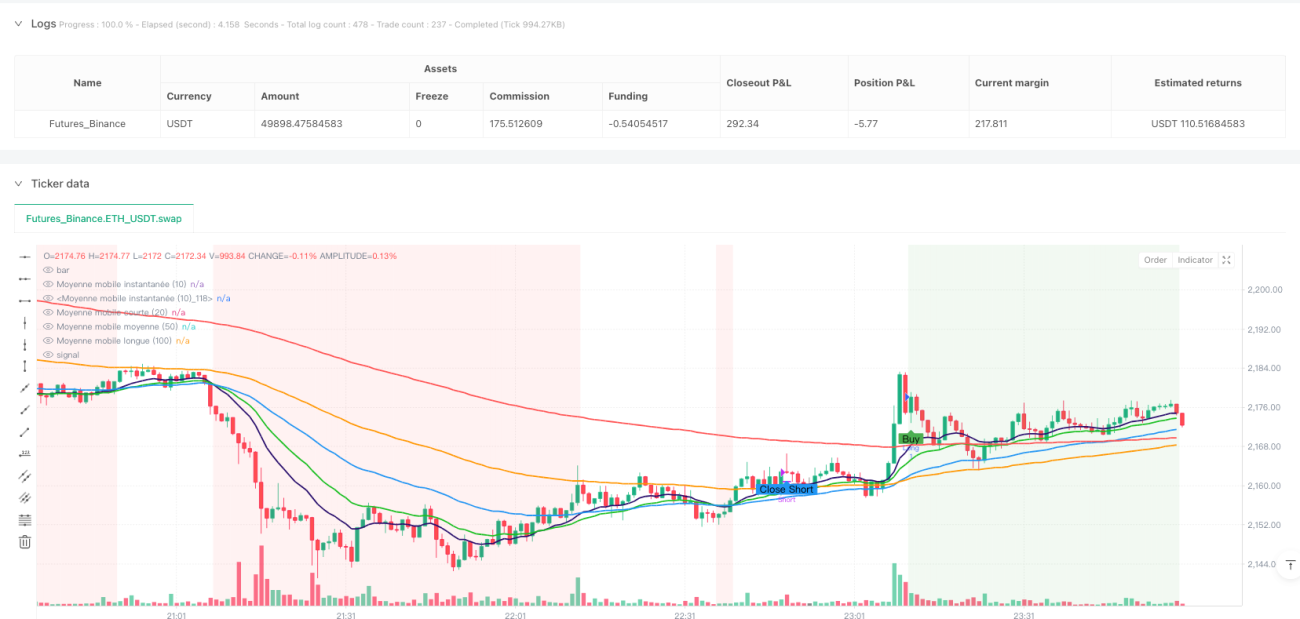
Visualized Trading Signals: The strategy clearly displays buy, sell, and exit points through graphical markers, facilitating backtesting analysis and real-time monitoring.
-
Trend Background Visualization: Using background colors to distinguish between uptrends and downtrends, providing an intuitive display of market conditions for traders to quickly assess the current market state.
-
Potential for Expansion: The strategy has already integrated RSI and MACD indicator calculations, which, although not currently used in the trading logic, provide a foundation for future optimization.
-
Parameter Adjustability: All key parameters can be controlled through inputs for adjustment, including moving average periods, RSI thresholds, MACD parameters, and ATR settings, making it convenient to optimize for different market environments and trading instruments.
Strategy Risks
-
Moving Average Lag: All systems based on moving averages have inherent lag, which may result in significant drawdowns in oscillating markets or during rapid reversals. Solutions include adjusting moving average periods or adding additional filters for oscillating market conditions.
-
Overtrading Risk: In oscillating markets, the instant moving average may frequently cross the short-term moving average, leading to excessive trading. This can be mitigated by introducing minimum holding periods or additional filters to reduce ineffective trades.
-
Market Adaptability Issues: Moving average strategies with fixed parameters tend to perform differently across various market environments and trading instruments. Parameters should be optimized for specific markets, or adaptive parameters should be considered.
-
Signal Conflicts: Although RSI and MACD indicators are calculated in the code, they are not effectively integrated into the trading logic, potentially leading to signal conflicts or missed optimization opportunities.
-
Long Bias: The current strategy applies different standards to long and short positions, with long positions not requiring volatility filtering while short positions must meet minimum ATR conditions, which may make the strategy more aggressive in bullish markets, increasing risk exposure.
-
Fixed Exit Mechanism: The strategy uses fixed technical indicator crossovers as exit points, lacking dynamic stop-loss and take-profit mechanisms that adjust according to market conditions, which may fail to effectively lock in profits or control risks.
-
Parameter Sensitivity: The strategy relies on multiple moving average period parameters, and small changes in these parameters can lead to significant differences in trading results, increasing the risk of overfitting.
Strategy Optimization Directions
-
Integrate Calculated Indicators: The strategy has already calculated RSI and MACD indicators but does not fully utilize them. RSI can be used to filter extreme market conditions, and MACD to confirm trend direction, improving signal quality. For example, requiring that RSI is not in overbought territory for long entries and not in oversold territory for short entries.
-
Dynamic Stop-Loss System: Introduce a dynamic stop-loss mechanism based on ATR, automatically adjusting stop-loss distances according to market volatility, enhancing risk management capabilities. This can be implemented by calculating entry points plus or minus a certain multiple of the ATR value.
-
Market State Classification: Add mechanisms to classify market states (trending vs. oscillating) and apply different trading strategies in different market states. For example, the slope of the long-term moving average or the ADX indicator can be used to assess trend strength.
-
Multi-Timeframe Analysis: Integrate trend information from higher timeframes, only trading when the trend direction aligns with higher timeframes, improving win rates.
-
Optimize Moving Average Parameters: The current strategy uses fixed moving average periods (14, 25, 50, 100, 200). Through backtesting different parameter combinations, optimal parameters for specific markets can be identified.
-
Volume Confirmation: Incorporate volume indicators to confirm trend strength, only trading in trends supported by volume, reducing losses from false breakouts.
-
Improve Entry Conditions: Optimize entry logic for both long and short positions to make them more symmetrical, or make more refined adjustments based on the characteristics of different market directions. For example, consider adding volatility filtering for long entries or adjusting the strictness of trend confirmation.
-
Add Time Filters: Incorporate trading time filters to avoid periods of high market volatility or poor liquidity, such as during important data releases or market opening/closing sessions.
Summary
The Multi-Moving Average Trend Capture and Crossover Confirmation Trading System is a quantitative trading strategy based on technical analysis that uses a combination of multiple moving averages of different periods to identify market trends, entering positions when trends are clearly established and exiting when trends weaken. The core advantage of the strategy lies in using multiple moving average crossovers to confirm trends, reducing erroneous signals and improving trading quality.
This strategy performs well in markets with clear trends but may face risks of overtrading in oscillating markets. By integrating the already calculated RSI and MACD indicators, introducing dynamic stop-loss mechanisms, optimizing moving average parameter combinations, and adding market state classification, the stability and adaptability of the strategy can be further enhanced.
For practical application, it is recommended to first conduct thorough backtesting across different market environments and trading instruments, adjusting parameters to adapt to specific market characteristics, and combining with money management strategies to control single-trade risk. Additionally, consider using this strategy as part of an investment portfolio, combined with other complementary strategies to diversify trading risk and improve overall portfolio stability.
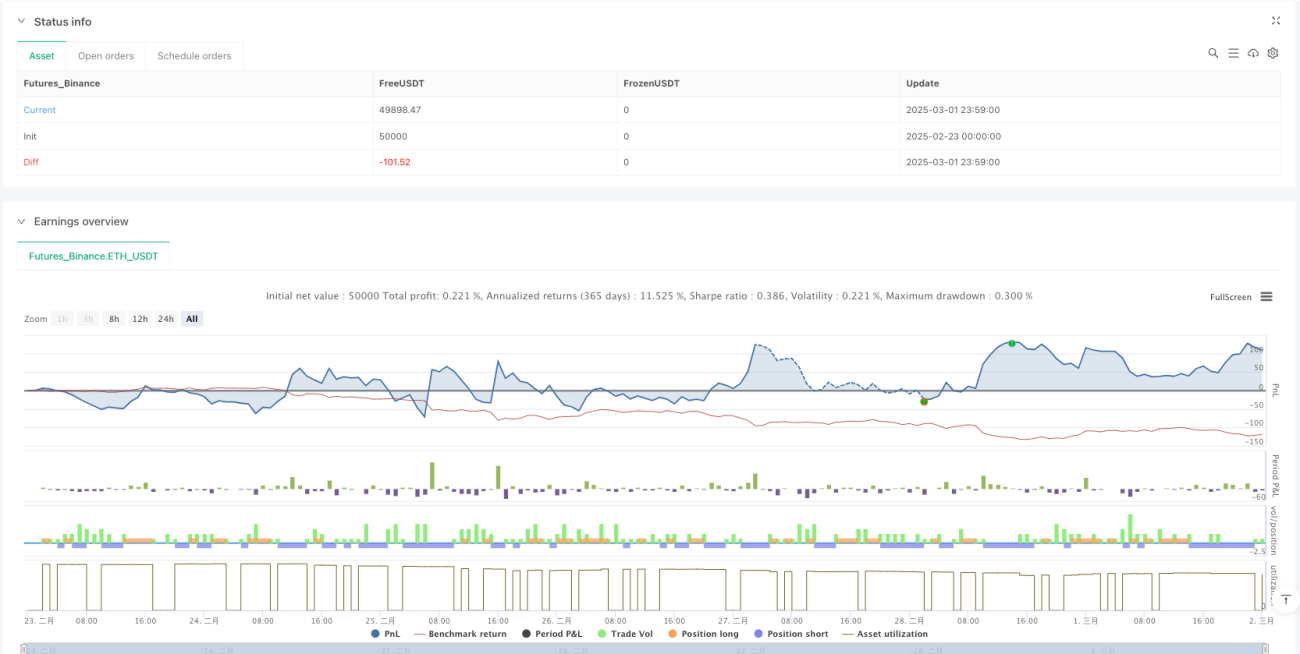
/*backtest
start: 2025-02-23 00:00:00
end: 2025-03-02 00:00:00
period: 1m
basePeriod: 1m
exchanges: [{"eid":"Futures_Binance","currency":"ETH_USDT"}]
*/

//@version=6
strategy("etude9", shorttitle="etude 9", overlay=true)
//on tente de comlbiner avec le RSi un stratégie pas si mauvaise sur les longs
// un d7 r rsi qui donne des indiciataions pas mal pour les short pour les long pas très concluant - 1