Overview
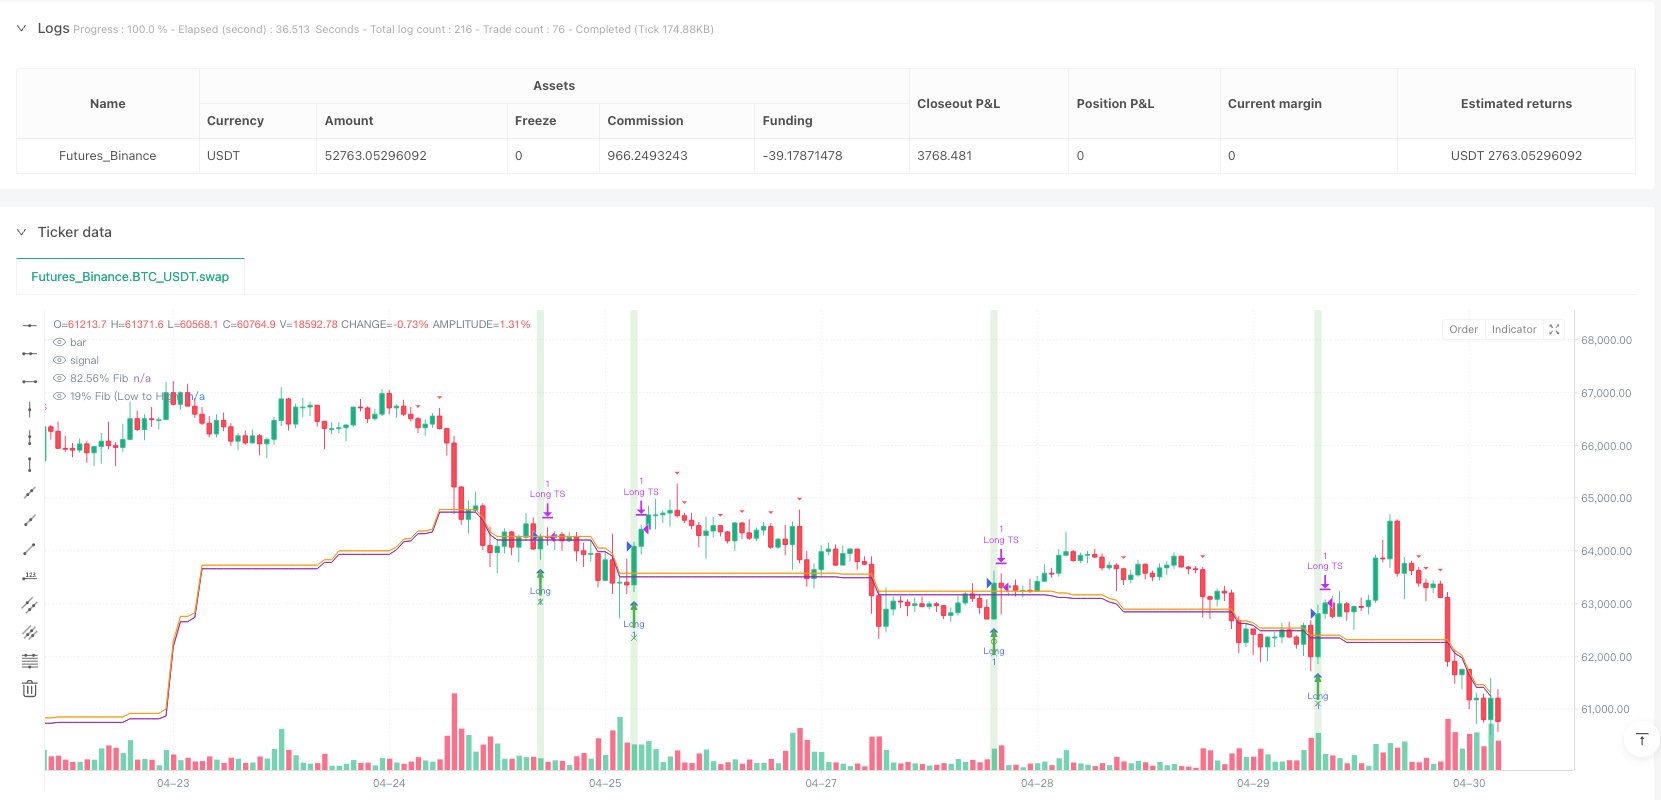
The Fibonacci Pattern Statistical Analysis Strategy is an advanced quantitative trading approach that cleverly combines three core technologies: Fibonacci retracement levels, pattern recognition algorithms, and statistical analysis. This strategy primarily utilizes the 19% and 82.56% Fibonacci retracement levels as the foundation for trading signals, while simultaneously identifying high-probability trade setups through pattern matching algorithms and confirming with statistical analysis. This multi-dimensional signal confirmation mechanism greatly enhances the strategy’s reliability and accuracy. The strategy provides clear entry and exit rules, including green up arrows indicating strong long signals, red down arrows indicating strong short signals, green backgrounds indicating long condition triggers, and red backgrounds indicating short condition triggers. Additionally, the strategy includes a status panel displaying current Fibonacci, pattern, and statistical conditions, as well as circle markers indicating Fibonacci touch signals, X-shaped markers indicating Fibonacci breakthrough signals, and text labels displaying detailed signal information including pattern similarity percentages.
Strategy Principles
The core principles of the Fibonacci Pattern Statistical Analysis Strategy are based on the collaborative work of three main components:
Fibonacci Retracement Levels: The strategy calculates special 19% and 82.56% Fibonacci retracement levels using the highest and lowest points within 93 periods. These unconventional Fibonacci levels are a unique aspect of the strategy, possibly derived from statistical analysis of specific market behaviors. Initial trading signals are generated when prices touch or break through these levels.
Pattern Recognition: The strategy implements a sophisticated pattern matching algorithm by analyzing past price patterns and calculating similarity with the current pattern. It uses a specified length of candlestick patterns (default 5) and searches for the best match in historical data (default 93 periods). If the similarity of the found pattern exceeds the set threshold (default 0.7), the strategy predicts possible price movements after the current pattern based on the price movements that followed this historical pattern.
Statistical Analysis: The strategy introduces a statistical confirmation mechanism by calculating median, quartiles, and interquartile range (IQR) to determine the statistical distribution of prices. Statistical signals are generated when prices cross the median, upper/lower quartiles, or exceed the upper/lower boundaries (defined as Q3 + 1.5 * IQR and Q1 - 1.5 * IQR). The strength of these signals is calculated based on the level of breakthrough and user-defined statistical weight.
The generation of trading signals is a comprehensive result of these three components: - Long conditions require Fibonacci touch or breakthrough signals (depending on user settings), with pattern direction being bullish or neutral. - Short conditions require Fibonacci touch or breakthrough signals, pattern direction being bearish or neutral, and statistical bearish weight greater than 0.
The strategy also implements sophisticated risk management mechanisms, including: - Optional percentage-based or ATR-based stop losses - Optional trailing stops - Seven-level scaled profit-taking mechanism, closing 14.28% of positions at each level
Strategy Advantages
Multi-dimensional Signal Confirmation: The strategy combines technical analysis (Fibonacci), pattern recognition, and statistical analysis in three dimensions, forming a powerful multiple confirmation mechanism that greatly reduces the possibility of false signals.
Strong Adaptability: The strategy provides rich parameter settings, including timeframe selection, pattern length, similarity threshold, historical lookback window, statistical period, etc., enabling it to adapt to different market environments and trading instruments.
Intelligent Pattern Recognition: The pattern matching algorithm not only considers the shape of patterns but also similarity thresholds, ensuring that only highly similar patterns are used for prediction, improving prediction accuracy.
Statistical Validation: By introducing quartile and IQR statistical methods, the strategy can identify the position of prices in the statistical distribution, providing additional objective basis for trading decisions.
Comprehensive Risk Management: The strategy offers multiple stop-loss options (fixed percentage, ATR multiple, trailing stop) and a seven-level scaled profit-taking mechanism, implementing flexible and systematic risk management.
Intuitive Visualization: The strategy provides rich visualization elements, including background colors, arrows, markers, and labels, helping traders intuitively understand current market conditions and signal strength.
Real-time Status Panel: The strategy displays a real-time updated status panel on the chart, clearly showing the current status of the Fibonacci, pattern, and statistical components, as well as their combined results.
Strategy Risks
Parameter Sensitivity: The strategy uses multiple parameters such as pattern length, similarity threshold, statistical period, etc., and the setting of these parameters significantly affects strategy performance. Improper parameter settings may lead to overfitting or missing signals. It is recommended to find appropriate parameter combinations for specific markets through backtesting optimization.
Market Environment Dependency: Fibonacci levels may fail in certain market environments, especially in strong trend markets or extremely volatile markets. The effectiveness of the strategy may vary with market conditions. The solution is to introduce a market environment detection mechanism and use different parameter settings in different market environments.
Computational Complexity: The pattern matching algorithm needs to traverse historical data and calculate similarity in each period, which may create computational burden on shorter timeframes. To alleviate this problem, consider optimizing the algorithm or reducing calculation frequency.
Overtrading Risk: Multiple signal mechanisms may lead to frequent trading signals, especially on shorter timeframes. It is recommended to add trading frequency limits or signal strength filters to execute only the highest quality signals.
Stop Loss Setting Challenges: Although the strategy provides multiple stop loss options, determining the optimal stop loss level remains a challenge. Stop losses that are too tight may lead to frequent stops, while those that are too wide may result in excessive losses. It is recommended to dynamically adjust stop loss levels based on market volatility.
Lack of Fundamental Considerations: The strategy is entirely based on technical and statistical analysis without considering fundamental factors. Pure technical strategies may face challenges when significant news or events occur. The solution is to add news filters or pause trading before and after major events.
Strategy Optimization Directions
Dynamic Parameter Adjustment: Adaptive mechanisms can be introduced to dynamically adjust parameters such as pattern length, similarity threshold, and statistical period based on market volatility or trend strength. This will improve the strategy’s adaptability in different market environments.
Enhanced Pattern Matching Algorithm: Current pattern matching is mainly based on the relationship between closing and opening prices (up, down, or flat). More complex pattern features such as high-low relationships, volume patterns, or volatility patterns can be considered to improve the accuracy of pattern recognition.
Market Environment Classification: Introduce market environment classification mechanisms, such as trend/range/chaos classification, and use different trading rules or parameter settings in different market environments. This will help the strategy better adapt to different market conditions.
Optimize Statistical Analysis: Consider using more complex statistical methods such as Z-scores or percentile rankings, or introducing dynamic statistical periods to improve the quality of statistical signals.
Integrate Machine Learning: Consider using machine learning algorithms to optimize pattern recognition and statistical weight allocation, or predict probability distributions of price movements after specific patterns.
Improve Risk Management: Implement dynamic position management strategies, adjusting position size based on signal strength, market volatility, and account risk. Additionally, the scaled profit-taking mechanism can be optimized to dynamically adjust profit targets based on market conditions.
Add Filters: Introduce various filters such as trend filters, volatility filters, or volume filters to further improve signal quality and reduce false signals.
Summary
The Fibonacci Pattern Statistical Analysis Strategy is a well-structured, feature-rich quantitative trading strategy that builds a powerful multi-dimensional signal system by innovatively combining Fibonacci retracement levels, pattern recognition, and statistical analysis. The core advantages of the strategy lie in its multi-layer confirmation mechanism, adaptive design, and comprehensive risk management functions, enabling it to find high-probability trading opportunities in different market environments.
However, the strategy also faces challenges such as parameter sensitivity, market environment dependency, and computational complexity. There is still significant room for improvement through introducing dynamic parameter adjustment, enhancing pattern matching algorithms, market environment classification, and machine learning.
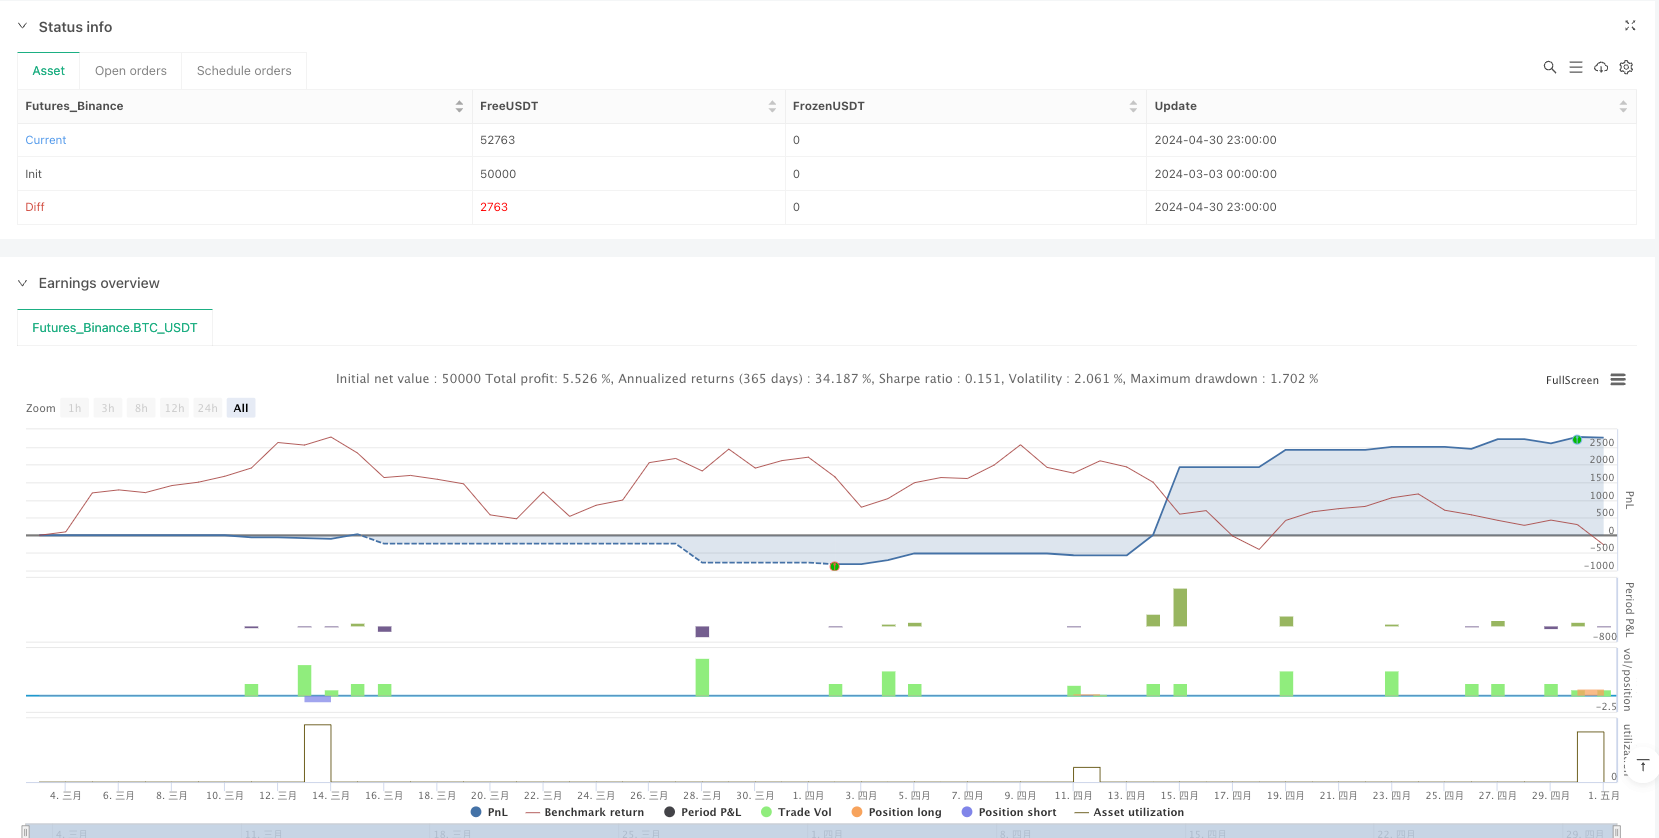
For traders wishing to use this strategy, it is recommended to first understand the performance of the strategy in different markets and parameter settings through backtesting, then start with small positions in live trading, gradually adjusting and optimizing parameters to adapt to specific trading styles and market environments. Most importantly, view this strategy as a tool in the trading toolbox rather than an isolated system, and combine it with other analytical methods and risk management principles to maximize its potential.
/*backtest
start: 2024-03-03 00:00:00
end: 2024-05-01 00:00:00
period: 1h
basePeriod: 1h
exchanges: [{"eid":"Futures_Binance","currency":"BTC_USDT"}]
*/

//@version=6
strategy("Fibonacci-Only Strategi V2", overlay=true)

timeframe = input.timeframe("15", "Select Timeframe", options=["1", "5", "15", "30", "60", "240", "D"])
use_break_strategy = input(true, "Use Break Strategy")
stop_loss_percent = input.float(1.0, "Stop Loss %", minval=0.1, maxval=2.0, step=0.1)
use_atr_for_sl = input(true, "Use ATR for Stop Loss")
atr_multiplier = input.float(2.0, "ATR Multiplier for SL", minval=0.5, maxval=5.0, step=0.1)
use_trailing_stop = input(true, "Use Trailing Stop")
trailing_stop_percent = input.float(1.5, "Trailing Stop %", minval=0.1, maxval=5.0, step=0.1)

pattern_length = input.int(5, "Candle Pattern Length", minval=3, maxval=10)
similarity_threshold = input.float(0.7, "Pattern Similarity Threshold", minval=0.6, maxval=0.95)
lookback_window = input.int(93, "Historical Lookback Window", minval=10, maxval=93)

stat_period = input.int(50, "Statistical Period", minval=20, maxval=200)
stat_weight = input.float(0.5, "Statistical Confirmation Weight", minval=0.1, maxval=1.0, step=0.1)

fib_high = ta.highest(high, 93)
fib_low = ta.lowest(low, 93)
fib_diff = fib_high - fib_low
fib_19 = fib_high - fib_diff * 0.19
fib_8256 = fib_high - fib_diff * 0.8256
fib_19_reverse = fib_low + fib_diff * 0.19

plot(fib_8256, color=color.purple, style=plot.style_line, title="82.56% Fib")
plot(fib_19_reverse, color=color.orange, style=plot.style_line, title="19% Fib (Low to High)")

fib_19_touch = low[1] > fib_19 and low <= fib_19
fib_8256_touch = high[1] < fib_8256 and high >= fib_8256
fib_19_break = close < fib_19 and open > fib_19
fib_8256_break = close > fib_8256 and open < fib_8256
fib_19_reverse_touch = high[1] < fib_19_reverse and high >= fib_19_reverse
fib_19_reverse_break = close > fib_19_reverse and open < fib_19_reverse

bull_confirmation = close > open
bear_confirmation = close < open

getMedianAndQuartiles(src, len) =>
    values = array.new_float(0)
    for i = 0 to len - 1
        array.push(values, src[i])
    array.sort(values)
    size = array.size(values)
    median = size % 2 == 1 ? array.get(values, math.floor(size / 2)) : (array.get(values, size / 2 - 1) + array.get(values, size / 2)) / 2
    q1_idx = math.floor(size / 4)
    q3_idx = math.floor(3 * size / 4)
    q1 = array.get(values, q1_idx)
    q3 = array.get(values, q3_idx)
    [median, q1, q3]

[price_median, price_q1, price_q3] = getMedianAndQuartiles(close, stat_period)
iqr = price_q3 - price_q1
upper_bound = price_q3 + 1.5 * iqr
lower_bound = price_q1 - 1.5 * iqr

stat_bull_signal = close > price_median and close[1] <= price_median
stat_bear_signal = close < price_median and close[1] >= price_median
stat_strong_bull = close > price_q3 and close[1] <= price_q3
stat_strong_bear = close < price_q1 and close[1] >= price_q1
stat_extreme_bull = close > upper_bound
stat_extreme_bear = close < lower_bound

long_condition_fib_touch = (fib_19_touch or fib_19_reverse_touch) and bull_confirmation
long_condition_fib_break = use_break_strategy and (fib_19_break or fib_19_reverse_break) and bull_confirmation

short_condition_fib_touch = fib_19_touch and bear_confirmation
short_condition_fib_break = use_break_strategy and fib_19_break and bear_confirmation

getPatternSignature(start_idx, len) =>
    pattern = array.new_float(len)

    for i = 0 to len - 1
        if close[start_idx + i] > open[start_idx + i]
            array.set(pattern, i, 1.0)
        else if close[start_idx + i] < open[start_idx + i]
            array.set(pattern, i, -1.0)
        else
            array.set(pattern, i, 0.0)

    pattern

calcSimilarity(current_pattern, hist_pattern) =>
    matches = 0.0

    for i = 0 to array.size(current_pattern) - 1
        if array.get(current_pattern, i) == array.get(hist_pattern, i)
            matches := matches + 1.0

    matches / array.size(current_pattern)

findBestMatch() =>
    curr_pattern = getPatternSignature(1, pattern_length)

    best_idx = -1
    best_sim = 0.0
    direction = 0

    for i = pattern_length + 2 to lookback_window + 1
        if i < pattern_length * 2
            continue

        hist_pattern = getPatternSignature(i, pattern_length)
        sim = calcSimilarity(curr_pattern, hist_pattern)

        if sim > best_sim and sim >= similarity_threshold
            best_sim := sim
            best_idx := i

            next_close = close[i - pattern_length - 1]
            curr_close = close[i - pattern_length]

            if next_close > curr_close
                direction := 1
            else if next_close < curr_close
                direction := -1

    [best_idx, best_sim, direction]

var latest_pattern_sim = 0.0
var pattern_direction = 0

if barstate.isconfirmed
    [idx, sim, dir] = findBestMatch()

    if sim >= similarity_threshold
        latest_pattern_sim := sim
        pattern_direction := dir

calculateStatWeight(stat_signal, stat_strong, stat_extreme) =>
    weight = 0.0
    if stat_signal
        weight := stat_weight * 0.5
    if stat_strong
        weight := weight + stat_weight * 0.3
    if stat_extreme
        weight := weight + stat_weight * 0.2
    weight

stat_bull_weight = calculateStatWeight(stat_bull_signal, stat_strong_bull, stat_extreme_bull)
stat_bear_weight = calculateStatWeight(stat_bear_signal, stat_strong_bear, stat_extreme_bear)

long_condition = (long_condition_fib_touch or long_condition_fib_break) and
                 (pattern_direction == 1 or pattern_direction == 0)

short_condition = (short_condition_fib_touch or short_condition_fib_break) and
                  (pattern_direction == -1 or pattern_direction == 0) and
                  stat_bear_weight > 0

atr = ta.atr(14)

if long_condition
    strategy.entry("Long", strategy.long)

if short_condition
    strategy.entry("Short", strategy.short)

var float long_stop_loss = na
var float short_stop_loss = na

if strategy.position_size > 0
    long_stop_loss := use_atr_for_sl ? strategy.position_avg_price - atr * atr_multiplier : strategy.position_avg_price * (1 - stop_loss_percent / 100)

if strategy.position_size < 0
    short_stop_loss := use_atr_for_sl ? strategy.position_avg_price + atr * atr_multiplier : strategy.position_avg_price * (1 + stop_loss_percent / 100)

take_profit_levels = array.new_float(7)
for i = 0 to 6
    tp_percent = 1 + (i + 1) * 0.5 / 100
    array.set(take_profit_levels, i, tp_percent * strategy.position_avg_price)

if strategy.position_size > 0
    if use_trailing_stop
        trail_price = high - (high - strategy.position_avg_price) * trailing_stop_percent / 100
        strategy.exit("Long TS", "Long", stop=math.max(trail_price, long_stop_loss))
    else
        strategy.exit("Long SL", "Long", stop=long_stop_loss)

    for i = 0 to 6
        long_tp_price = array.get(take_profit_levels, i)
        strategy.exit("Long TP" + str.tostring(i+1), "Long", limit=long_tp_price, qty_percent=14.28)

if strategy.position_size < 0
    if use_trailing_stop
        trail_price = low + (strategy.position_avg_price - low) * trailing_stop_percent / 100
        strategy.exit("Short TS", "Short", stop=math.min(trail_price, short_stop_loss))
    else
        strategy.exit("Short SL", "Short", stop=short_stop_loss)

    for i = 0 to 6
        short_tp_price = array.get(take_profit_levels, i)
        strategy.exit("Short TP" + str.tostring(i+1), "Short", limit=short_tp_price, qty_percent=14.28)

bgcolor(long_condition ? color.new(color.green, 80) : short_condition ? color.new(color.red, 80) : na)

plotarrow(long_condition ? 1 : short_condition ? -1 : 0, title="Signal Direction", colorup=color.green, colordown=color.red, minheight=10, maxheight=20)

long_touch_marker = long_condition and long_condition_fib_touch ? low - atr : na
long_break_marker = long_condition and long_condition_fib_break ? low - atr * 1.5 : na
short_touch_marker = short_condition and short_condition_fib_touch ? high + atr : na
short_break_marker = short_condition and short_condition_fib_break ? high + atr * 1.5 : na

plotshape(long_touch_marker, style=shape.circle, color=color.green, size=size.normal, title="Long Touch Marker", location=location.absolute)
plotshape(long_break_marker, style=shape.xcross, color=color.green, size=size.normal, title="Long Break Marker", location=location.absolute)
plotshape(short_touch_marker, style=shape.circle, color=color.red, size=size.normal, title="Short Touch Marker", location=location.absolute)
plotshape(short_break_marker, style=shape.xcross, color=color.red, size=size.normal, title="Short Break Marker", location=location.absolute)

plotshape(stat_bear_signal, style=shape.triangledown, color=color.red, size=size.tiny, title="Statistical Bear Signal", location=location.abovebar)

if barstate.islast
    var table info = table.new(position.top_right, 4, 5, color.black, color.white, 2, color.gray, 2)

    table.clear(info, 0, 0, 3, 4)

    table.cell(info, 0, 0, "Fibonacci-Pattern with Stats", bgcolor=color.blue, text_color=color.white)
    table.cell(info, 0, 1, "Fib Status", bgcolor=color.blue, text_color=color.white)

    fib_status = "NEUTRAL"
    fib_color = color.gray

    if long_condition_fib_touch or long_condition_fib_break
        fib_status := "LONG"
        fib_color := color.green
    else if short_condition_fib_touch or short_condition_fib_break
        fib_status := "SHORT"
        fib_color := color.red

    table.cell(info, 1, 1, fib_status, bgcolor=fib_color, text_color=color.white)

    table.cell(info, 0, 2, "Pattern", bgcolor=color.blue, text_color=color.white)

    pattern_status = "NEUTRAL"
    pattern_color = color.gray

    if pattern_direction == 1
        pattern_status := "LONG"
        pattern_color := color.green
    else if pattern_direction == -1
        pattern_status := "SHORT"
        pattern_color := color.red

    table.cell(info, 1, 2, pattern_status, bgcolor=pattern_color, text_color=color.white)
    table.cell(info, 2, 2, pattern_direction != 0 ? str.tostring(math.round(latest_pattern_sim * 100)) + "%" : "N/A", bgcolor=color.gray, text_color=color.white)

    table.cell(info, 0, 3, "Statistics", bgcolor=color.blue, text_color=color.white)

    stat_status = "NEUTRAL"
    stat_color = color.gray

    if stat_bull_weight > 0
        stat_status := "BULL"
        stat_color := color.green
    else if stat_bear_weight > 0
        stat_status := "BEAR"
        stat_color := color.red

    table.cell(info, 1, 3, stat_status, bgcolor=stat_color, text_color=color.white)
    table.cell(info, 2, 3, stat_bull_weight > 0 ? str.tostring(math.round(stat_bull_weight * 100)) + "%" :
                          stat_bear_weight > 0 ? str.tostring(math.round(stat_bear_weight * 100)) + "%" : "0%",
                          bgcolor=color.gray, text_color=color.white)

    table.cell(info, 0, 4, "Combined", bgcolor=color.blue, text_color=color.white)

    combined_status = "NEUTRAL"
    combined_color = color.gray

    if long_condition
        combined_status := "LONG"
        combined_color := color.green
    else if short_condition
        combined_status := "SHORT"
        combined_color := color.red

    table.cell(info, 1, 4, combined_status, bgcolor=combined_color, text_color=color.white)

var label_id = label.new(na, na, "", color=color.gray, style=label.style_label_down, textcolor=color.white)

if long_condition and barstate.isconfirmed
    label.set_xy(label_id, bar_index, high)
    label.set_text(label_id, "LONG\n" +
                           (long_condition_fib_touch ? "Touch" : "Break") +
                           (pattern_direction == 1 ? " + Pattern " + str.tostring(math.round(latest_pattern_sim * 100)) + "%" : "") +
                           "\nStat: " + str.tostring(math.round(stat_bull_weight * 100)) + "%")
    label.set_color(label_id, color.green)
    label.set_style(label_id, label.style_label_down)

if short_condition and barstate.isconfirmed
    label.set_xy(label_id, bar_index, low)
    label.set_text(label_id, "SHORT\n" +
                           (short_condition_fib_touch ? "Touch" : "Break") +
                           (pattern_direction == -1 ? " + Pattern " + str.tostring(math.round(latest_pattern_sim * 100)) + "%" : "") +
                           "\nStat: " + str.tostring(math.round(stat_bear_weight * 100)) + "%")
    label.set_color(label_id, color.red)
    label.set_style(label_id, label.style_label_up)

alertcondition(long_condition, title="Long Entry", message="Long entry signal detected")
alertcondition(short_condition, title="Short Entry", message="Short entry signal detected")