
Overview
The Dynamic Breakout Master Channel Strategy is an adaptive trading system based on support and resistance breakouts, designed to capture potential profit opportunities by dynamically identifying key support and resistance levels in the market. The core of this strategy lies in constructing a dynamic channel that automatically adjusts to market conditions, tracking price movements in real-time and generating trading signals when key levels are broken. The strategy employs a pivot point algorithm to identify support and resistance zones, and generates trading decisions based on the strength and influence of these zones.
This strategy offers a rich set of customizable parameters, including pivot period, data source selection, channel width limitations, minimum pivot strength requirements, and the number of support/resistance zones to display. These options allow traders to make flexible adjustments according to different market environments and personal preferences. Additionally, the strategy supports the integration of moving averages to provide additional technical analysis perspectives for trading decisions.
In terms of trading logic, the system triggers a buy signal when the price breaks above a resistance zone, and a sell signal when the price breaks below a support zone. To better reflect real trading conditions, the strategy also incorporates a 0.1% commission cost calculation.
Strategy Principles
The core principle of the Dynamic Breakout Master Channel Strategy is based on the identification and breakout of support and resistance levels in market structure. Its technical implementation includes the following key steps:
-
Pivot Identification: The strategy uses Pine Script's
pivothighandpivotlowfunctions to detect high and low points in the price chart, which are viewed as potential support and resistance levels. Users can choose to use either "High/Low" or "Close/Open" data sources to determine these pivot points. -
Dynamic Channel Calculation: The system constructs dynamic support and resistance channels based on the identified pivot points. Through the
my_channelfunction, the strategy calculates the area around each pivot point and determines the upper (ceiling) and lower (floor) limits of the channel based on its strength. The channel width is limited by themymaxwidthparameter, which is calculated based on the price range of the most recent 300 candles. -
Zone Strength Assessment: The strategy not only considers the pivot points themselves but also evaluates the strength of each support/resistance zone. The strength score is based on two factors: the number of pivot points within the zone (initial strength of 20 points per pivot) and the frequency of price activity within the zone (adding 1 point for each touch).
-
Zone Filtering and Sorting: The system filters out zones with strength exceeding the user-defined threshold (
mystrength * 20) and sorts them by strength from highest to lowest. A maximum number of support/resistance zones specified by the user (mymaxzones) are displayed. -
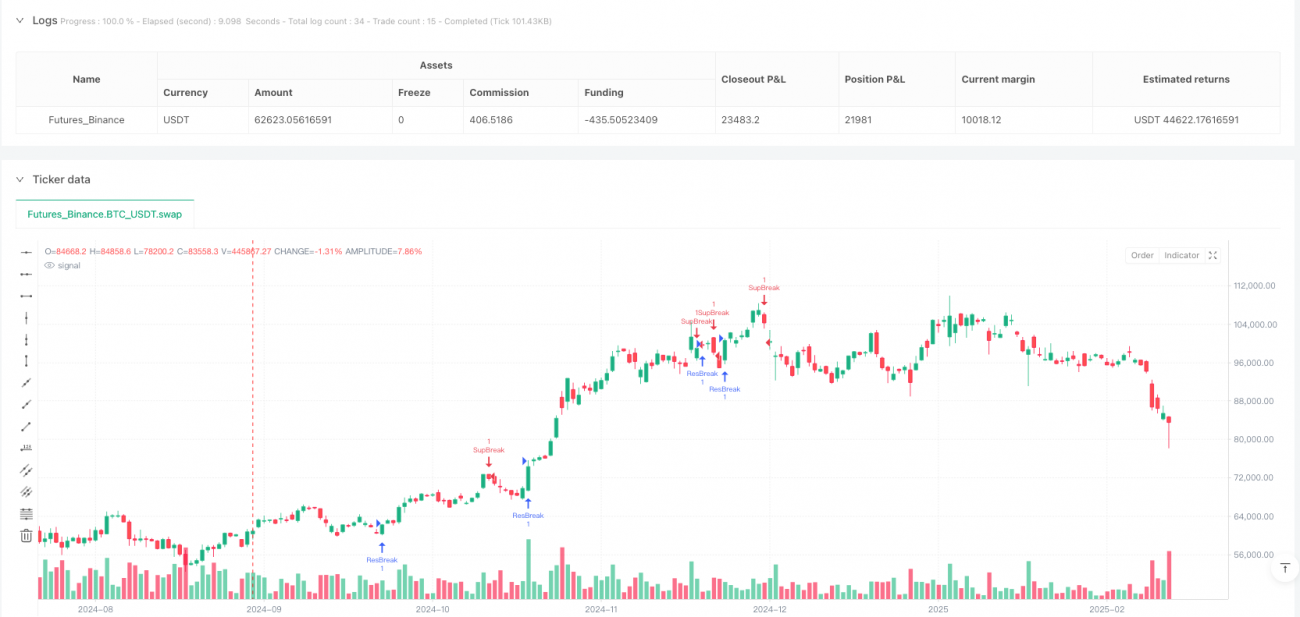
Breakout Detection: The strategy detects breakouts by comparing the current closing price with the position of the previous candle relative to the support/resistance zones. When the price moves from inside a zone to outside, crossing either the upper boundary (resistance breakout) or lower boundary (support breakout) of the zone, the system identifies it as a valid breakout.
-
Trading Signal Generation: A long signal ("ResBreak") is triggered when a resistance breakout is detected, and a short signal ("SupBreak") is triggered when a support breakout is detected.
Strategy Advantages
-
Strong Adaptability: The greatest advantage of the Dynamic Breakout Master Channel Strategy is its adaptability. By dynamically identifying and updating support and resistance zones, this strategy can adapt to different market environments and price fluctuation patterns, avoiding the potential lag issues that may exist with static support and resistance lines.
-
Multi-dimensional Strength Assessment: The strategy evaluates support and resistance zones through a multi-dimensional strength assessment that considers both the number of pivot points and the frequency of price activity. This approach can more accurately identify truly important key zones in the market, reducing the possibility of false breakouts.
-
High Customization Flexibility: The strategy offers a rich set of parameter settings, including pivot period, strength threshold, channel width, and more, allowing traders to make fine adjustments according to different trading instruments, time frames, and personal risk preferences.
-
Excellent Visualization: The strategy visually displays support and resistance zones and breakout points on the chart, with different colors representing different types of zones (resistance, support, or middle zone), helping traders to understand market structure and potential trading opportunities more intuitively.
-
Integration of Moving Averages: The strategy allows the addition of two moving averages with different parameters (either SMA or EMA), providing additional trend analysis perspectives for trading decisions, particularly suitable for users who are accustomed to combining multiple technical indicators for trading.
-
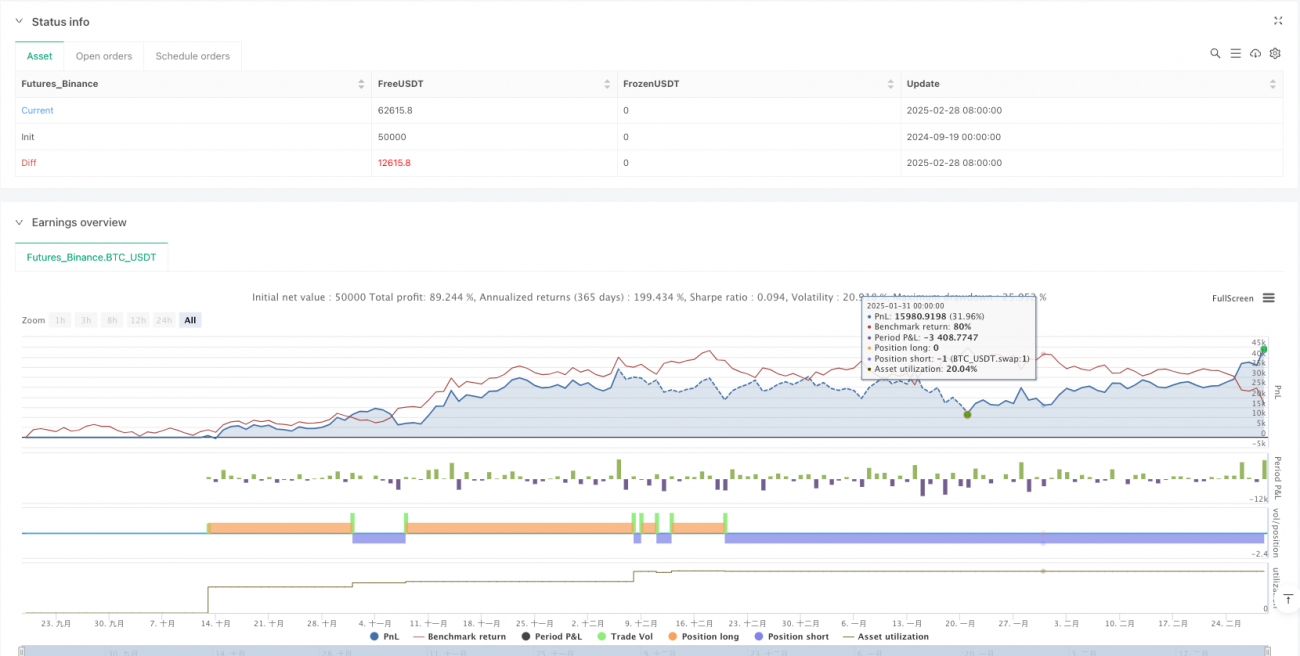
Trading Cost Consideration: The strategy incorporates trading commission (0.1%) calculation in backtesting, making the backtest results closer to real trading environments and helping traders make more realistic expectations.
Strategy Risks
-
False Breakout Risk: Despite the strategy's strength assessment and filtering mechanisms to reduce false signals, false breakouts may still occur in highly volatile markets, where the price briefly breaks through a support/resistance zone before falling back into the original zone. This may lead to unnecessary trading losses.
Solution: Add confirmation mechanisms, such as requiring the price to maintain a certain time or magnitude after breakout before triggering a trading signal, or combining volume indicators for breakout confirmation.
-
Parameter Sensitivity: The strategy's performance is relatively sensitive to parameter settings (such as pivot period, minimum strength, etc.), and inappropriate parameter choices may lead to excessive or insufficient trading signals.
Solution: It is recommended to conduct thorough parameter optimization and backtesting before live trading, to find the optimal parameter combination for specific trading instruments and time frames.
-
Market Environment Adaptability: This strategy performs well in range-bound markets but may be less effective in strong trend markets or extremely low volatility markets.
Solution: Add market environment recognition mechanisms to automatically adjust strategy parameters or pause trading under different market conditions.
-
Lack of Stop-Loss Mechanism: The current strategy only defines entry signals without clear stop-loss and profit-taking strategies, which may lead to excessive losses in unfavorable market conditions.
Solution: It is recommended to add stop-loss strategies, such as setting stop-loss levels based on support/resistance zones, or using trailing stop mechanisms to protect existing profits.
-
Historical Data Dependency: The strategy uses historical data (up to 400 candles) to identify support and resistance zones, and may not perform well when data is insufficient or when market structure undergoes fundamental changes.
Solution: Consider dynamically adjusting the historical data range, or adding other market structure change detection mechanisms to improve adaptability.
Strategy Optimization Directions
-
Integrate Volume Analysis: The current strategy makes decisions based solely on price data. It is recommended to integrate volume analysis to enhance the reliability of breakout signals. Volume typically increases significantly during true breakouts, a characteristic that can help filter out many false breakout signals. This can be implemented by adding volume threshold conditions, triggering trading signals only when breakouts are accompanied by sufficient volume.
-
Introduce Dynamic Stop-Loss Mechanism: Add an intelligent stop-loss system to the strategy, such as setting stop-loss distances based on ATR (Average True Range), or using adjacent support/resistance zones as stop-loss reference points. This not only controls risk for individual trades but also automatically adjusts risk exposure based on market volatility.
-
Add Trend Filter: Introduce a trend recognition mechanism, allowing breakout trades in the direction of strong trends while being more cautious about breakout signals in the opposite direction of the trend. This can be achieved by analyzing the slope of long-term moving averages or using trend strength indicators such as ADX (Average Directional Index).
-
Add Time Filter: Breakouts during certain time periods (such as market opening or before closing) may be less reliable. Adding time filtering functionality, avoiding trading during statistically unfavorable time periods, can improve overall win rate.
-
Optimize Zone Strength Algorithm: The current strength assessment algorithm can be further optimized, for example, by considering the age of pivot points (newer pivot points may be more relevant), or introducing factors such as the number of times a zone has been tested but not broken (zones that have been tested multiple times without breaking may have higher strength).
-
Add Position Management Logic: Dynamically adjust position size based on zone strength, market volatility, or other risk factors, increasing position in high-confidence situations and reducing exposure in higher-risk situations.
-
Implement Adaptive Parameters: Design key parameters (such as pivot period, channel width, etc.) to be adaptive, automatically adjusting based on market volatility or other conditions, reducing the subjectivity of manual parameter selection.
Summary
The Dynamic Breakout Master Channel Strategy is a technically advanced and highly flexible trading system, with its core advantage being the ability to dynamically identify and evaluate key support and resistance zones in the market, and capture potential trading opportunities when these zones break. Through carefully designed pivot point identification algorithms and zone strength assessment mechanisms, this strategy can adapt to different market environments and provide relatively reliable entry signals.
Customizability is another major feature of the strategy, with a rich set of parameter options allowing traders to make fine adjustments according to personal preferences and the characteristics of trading instruments. In addition, the strategy's visualization is very intuitive, with clear marking of support/resistance zones and breakout points helping traders to better understand market structure and trading logic.
However, the strategy also has some limitations, such as false breakout risk and lack of built-in stop-loss mechanisms. To further enhance strategy performance, it is recommended to consider integrating volume analysis, adding intelligent stop-loss systems, introducing trend filters, and optimizing zone strength algorithms. These optimization measures will help improve the reliability and profitability stability of the strategy.
In practical application, traders should combine their own risk tolerance and market experience, through thorough backtesting and simulation trading to familiarize themselves with and optimize strategy parameters, avoiding blindly following signal trading. At the same time, using this strategy as part of a complete trading system, combined with other analysis tools and risk management rules, may achieve more ideal trading results.
/*backtest
start: 2024-09-19 00:00:00
end: 2025-03-01 08:00:00
period: 1d
basePeriod: 1d
exchanges: [{"eid":"Futures_Binance","currency":"BTC_USDT"}]
*/

// This Pine Script™ code is subject to the terms of the Mozilla Public License 2.0 at https://mozilla.org/MPL/2.0/
// © tradingbauhaus

//@version=6- 1