Multi-Indicator Trend Confirmation Momentum Trading Strategy

Overview
The Multi-Indicator Trend Confirmation Momentum Trading Strategy is a comprehensive technical analysis approach that combines multiple technical indicators to confirm market trends and momentum for generating trading signals. This strategy primarily utilizes moving average crossovers, Relative Strength Index (RSI), Moving Average Convergence Divergence (MACD), and Fibonacci retracement levels to filter trading signals and improve trading success rates. The strategy is designed to capture key trend reversal moments, executing trades only when multiple indicators confirm simultaneously, thereby reducing false signals.
Strategy Principles
The core principle of the Multi-Indicator Trend Confirmation Momentum Trading Strategy is to identify strong trading opportunities through the confirmation of multiple technical indicators. Specifically, the strategy employs the following indicator combination:
-
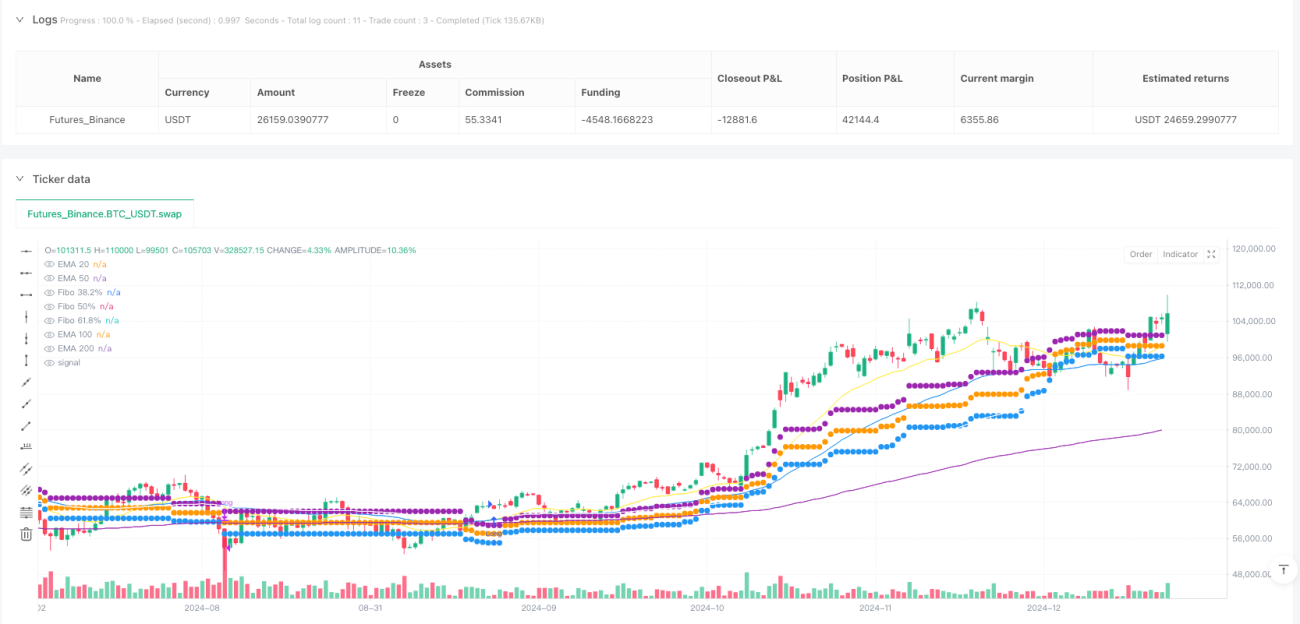
Moving Average System: The strategy uses four Exponential Moving Averages (EMAs): 20-period, 50-period, 100-period, and 200-period. The crossover between the 20 and 50-period EMAs triggers trading signals, while the 200-period EMA serves as a confirmation indicator for the overall trend.
-
Relative Strength Index (RSI): A 14-period RSI is used to measure price momentum. Buy signals require RSI greater than 50 (indicating upward momentum), while sell signals require RSI less than 50 (indicating downward momentum).
-
MACD Indicator: Using standard parameter settings (12, 26, 9), the relative position of the MACD line to the signal line confirms trend direction.
-
Fibonacci Retracement Levels: 38.2%, 50%, and 61.8% Fibonacci retracement levels are calculated based on the highest and lowest prices of the past 50 periods, used to identify potential support and resistance areas.
Buy conditions simultaneously satisfy the following requirements:
- 20-period EMA crosses above the 50-period EMA (indicating short-term trend turning upward)
- RSI greater than 50 (confirming upward momentum)
- MACD line above the signal line (further confirming upward momentum)
- Price above the 200-period EMA (confirming long-term uptrend)
Sell conditions simultaneously satisfy the following requirements:
- 20-period EMA crosses below the 50-period EMA (indicating short-term trend turning downward)
- RSI less than 50 (confirming downward momentum)
- MACD line below the signal line (further confirming downward momentum)
- Price below the 200-period EMA (confirming long-term downtrend)
Strategy Advantages
-
Multiple Confirmation Mechanism: The strategy requires confirmation from multiple indicators to generate trading signals, greatly reducing the possibility of false signals and improving trading accuracy.
-
Combination of Trend and Momentum: By combining moving averages (trend indicators) with RSI and MACD (momentum indicators), the strategy captures both trend changes and price momentum, making trading more comprehensive.
-
Integration of Long and Short-term Trends: By combining short-term moving averages (20 and 50-period) with long-term moving averages (200-period), the strategy can capture short-term trading opportunities while confirming long-term trends.
-
Visual Intuition: The strategy marks buy and sell signals on the chart while displaying various moving averages and Fibonacci levels, making it easy for traders to visually understand market conditions and trading logic.
-
Strong Adaptability: Although designed for the forex market, the principles of this strategy are applicable to various financial markets and timeframes with appropriate parameter adjustments.
-
Avoids Frequent Trading: Due to the requirement for multiple conditions to be met simultaneously, the strategy does not trade frequently, reducing transaction costs and emotional fluctuations.
Strategy Risks
-
Lag Risk: Moving averages, RSI, and MACD are all lagging indicators, which may cause trading signals to appear after the optimal entry point has passed, especially in rapidly changing markets.
-
Poor Performance in Ranging Markets: In sideways or oscillating markets, moving average crossovers may occur frequently, leading to increased false signals and affecting strategy performance.
-
Parameter Sensitivity: The strategy uses fixed parameters (such as EMA periods, RSI thresholds, etc.), and different market conditions may require different parameter settings for optimal results.
-
Lack of Stop-Loss Mechanism: The current strategy does not have a clear stop-loss mechanism, which may lead to significant losses during sudden market reversals.
-
Over-reliance on Technical Indicators: The strategy relies entirely on technical indicators, ignoring fundamental factors and market sentiment, which may fail in the face of major news events or black swan events.
-
Over-filtering Risk: Requiring multiple conditions to be met simultaneously may over-filter trading signals, leading to missed potential profit opportunities.
Strategy Optimization Directions
-
Add Stop-Loss and Profit Targets: Introduce stop-loss and profit target settings based on ATR (Average True Range) or Fibonacci levels to control risk and lock in profits.
-
Optimize Parameter Settings: Optimize the parameters of various indicators, such as EMA periods and RSI thresholds, through backtesting for different markets and timeframes to improve strategy adaptability.
-
Add Volume Indicators: Incorporate volume analysis into the strategy, executing trades only when confirmed by volume, further reducing false signals.
-
Introduce Adaptive Parameters: Allow indicator parameters to adjust automatically based on market volatility, such as using adaptive moving averages or dynamically adjusting RSI thresholds based on market conditions.
-
Add Market State Identification: Develop a mechanism to identify whether the market is in a trending or ranging state, and adjust strategy logic accordingly, such as pausing trading in ranging markets or adopting reversal logic.
-
Integrate Fundamental Analysis: Consider pausing trading before and after important economic data releases, or adjusting strategy parameters in conjunction with the economic calendar to respond to fundamental factors.
-
Add Time Filters: Set up trading filters for different market active periods, avoiding periods of low liquidity or abnormal volatility.
Summary
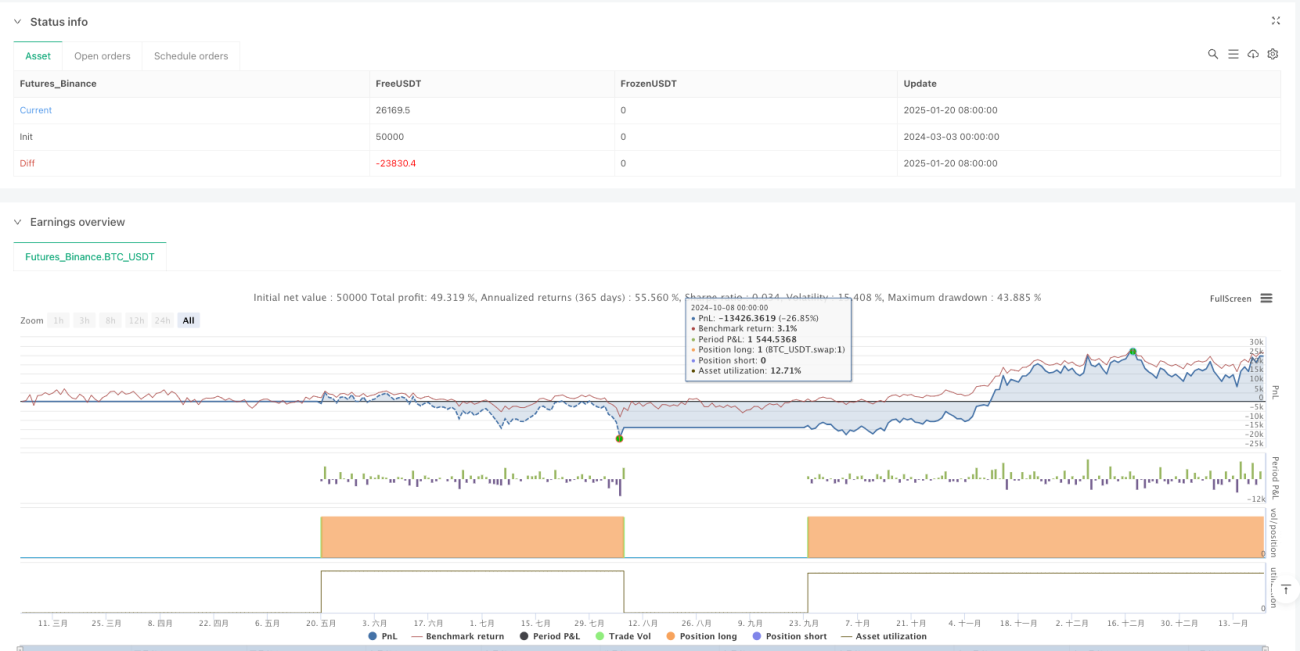
The Multi-Indicator Trend Confirmation Momentum Trading Strategy is a robust technical analysis method that provides a systematic trading framework through the synergy of moving average systems, RSI, MACD, and Fibonacci levels. The core advantage of this strategy lies in its multiple confirmation mechanism, effectively reducing the risk of false signals, making it suitable for risk-averse traders.
However, the strategy also has limitations such as lag, parameter sensitivity, and lack of stop-loss mechanisms. By introducing stop-loss settings, optimizing parameters, adding volume confirmation, and incorporating market state identification, the stability and profitability of the strategy can be further enhanced.
This strategy is particularly suitable for markets with clear trends and for traders with a certain foundation in technical analysis. For beginners, it is recommended to first test and learn in a demo account, become familiar with the interaction of various indicators and strategy logic before considering application in live trading. Through continuous learning and optimization, this strategy can become an important component in a trader's technical analysis toolkit.
- 1