Dynamic ATR Trailing Stop Trading Strategy: Market Volatility Adaptive System

Overview
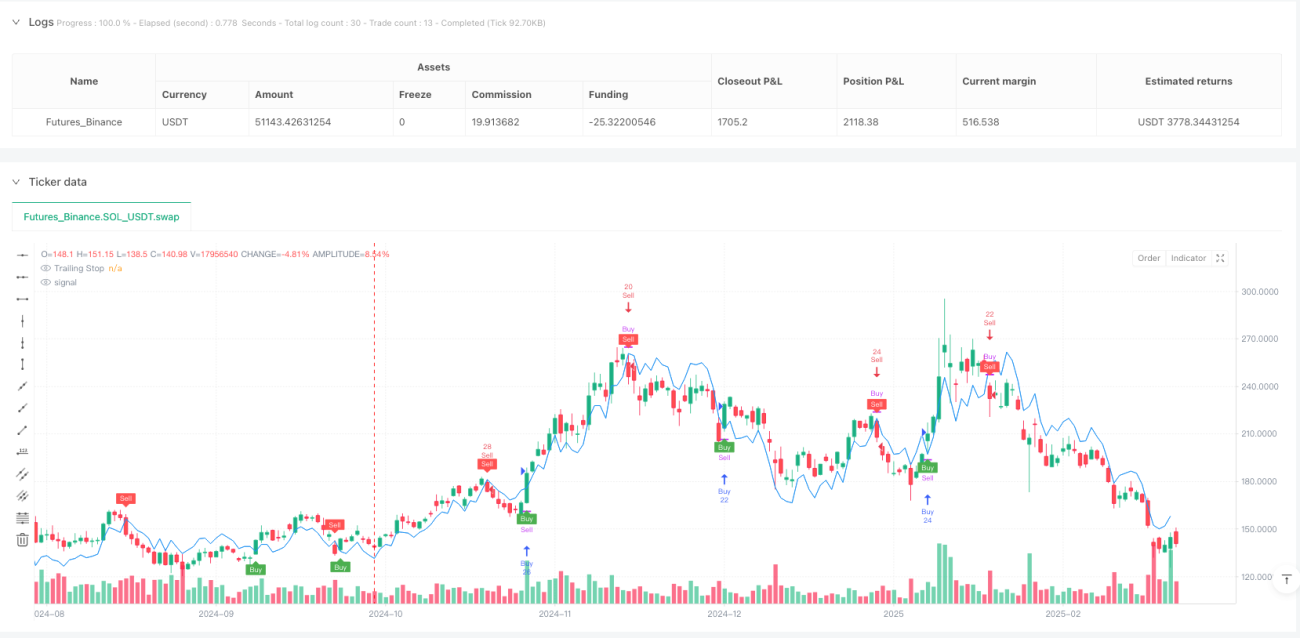
The Dynamic ATR Trailing Stop Trading Strategy is a quantitative trading system based on the Average True Range (ATR) indicator. The core of this strategy lies in utilizing market volatility to dynamically calculate a trailing stop line, thereby capturing price trend changes and automatically executing buy and sell operations. This strategy generates buy signals when price breaks above the trailing stop line and sell signals when price falls below the trailing stop line, while automatically closing positions during trend reversals to protect existing profits and control risk. The system also provides an intuitive graphical interface and automated alert functionality to help traders better monitor market dynamics.
Strategy Principle
The core principle of this strategy is based on using the ATR indicator to dynamically calculate trailing stop levels. The strategy implementation includes the following key components:
-
Dynamic Trailing Stop Calculation:
- Using the ATR indicator to measure market volatility:
xATR = ta.atr(c), where c is the ATR calculation period - Adjusting the stop distance through sensitivity parameter a:
nLoss = a * xATR - Dynamically adjusting the trailing stop line based on price position:
xATRTrailingStop := src > nz(xATRTrailingStop[1], 0) ? src - nLoss : src + nLoss, which means in an uptrend, the stop line follows the price upward but maintains a certain distance; in a downtrend, the opposite occurs
- Using the ATR indicator to measure market volatility:
-
Signal Generation Logic:
- Buy signal: When price breaks above the trailing stop line
buyCondition = ta.crossover(src, xATRTrailingStop) - Sell signal: When price falls below the trailing stop line
sellCondition = ta.crossunder(src, xATRTrailingStop)
- Buy signal: When price breaks above the trailing stop line
-
Position Management:
- When a buy signal is triggered, all sell positions are closed first, then new buy positions are opened
- When a sell signal is triggered, all buy positions are closed first, then new sell positions are opened
- Positions are automatically closed when price crosses the trailing stop line, preventing losses from significant market reversals
-
Graphical Display:
- Blue line displays the trailing stop level
- Green markers indicate buy signals, red markers indicate sell signals
- Candle colors dynamically adjust to green (uptrend) or red (downtrend) based on the relationship between price and trailing stop line
-
Custom Parameters:
- Sensitivity parameter a: Controls the sensitivity of the trailing stop line, smaller values increase sensitivity
- ATR period c: Controls the time window for ATR calculation
- Smoothing option h: Option to use Heikin Ashi candles for signal calculation
Strategy Advantages
This strategy has the following significant advantages:
-
Adapts to Market Volatility: Through the ATR indicator, the strategy can automatically adjust the stop loss distance based on changes in market volatility, providing a wider stop distance in high volatility environments and a tighter stop distance in low volatility environments.
-
Trend Following Capability: The strategy is designed to follow market trends, able to enter at the early stages of trend formation and continuously hold positions as the trend develops, maximizing profit opportunities within trends.
-
Clear Entry and Exit Signals: Generates clear buy and sell signals based on the crossover relationship between price and the trailing stop line, avoiding subjective judgment and improving trading discipline.
-
Automated Risk Control: Through the trailing stop mechanism, the strategy can automatically protect existing profits and limit the maximum loss per trade, particularly suitable for traders who do not wish to manually manage stop losses.
-
Intuitive Visual Feedback: The strategy provides clear visual indicators, including the trailing stop line, buy/sell signal markers, and candle color changes, allowing traders to intuitively understand market status and strategy signals.
-
Comprehensive Alert System: Built-in automated alert functionality that can receive real-time trading signal notifications through various channels (such as Telegram, Discord, email, etc.), making it convenient for traders to respond to market changes promptly.
Strategy Risks
Despite its many advantages, the strategy also has the following risks and limitations:
-
False Signals in Oscillating Markets: In sideways, oscillating markets, price may frequently cross the trailing stop line, leading to excessive trading and consecutive losses. The solution is to add auxiliary filtering conditions, such as combining trend indicators or pausing trading in low volatility environments.
-
Parameter Sensitivity: Strategy performance is highly dependent on parameters a and c. Improper parameter settings may lead to premature stop losses or overly loose stops, affecting overall performance. It is recommended to optimize parameters through backtesting in different market environments to find the optimal balance.
-
Impact of Slippage and Trading Costs: In live trading, slippage and trading fees can significantly impact strategy profitability, especially when trading frequency is high. These factors should be considered in backtesting, and parameters should be adjusted appropriately to reduce the number of trades.
-
Market Gap Risk: In cases of significant market gaps, the actual stop loss position may be far lower than the theoretical stop loss position, causing losses to exceed expectations. It is advisable to set additional fixed stop losses as a last line of defense.
-
Trend Reversal Delay: The strategy may react slowly in the initial stages of trend reversal, leading to partial profit giveback. Consider combining momentum indicators or volatility breakthrough indicators to identify potential trend reversals in advance.
Strategy Optimization Directions
Addressing the above risks and limitations, the strategy can be optimized in the following directions:
-
Add Trend Filters: Combine other trend indicators (such as moving averages, ADX, etc.) to confirm trend direction, only trading in the confirmed trend direction to avoid false signals in oscillating markets. This is because relying solely on price and trailing stop line crossovers may be overly sensitive to market noise.
-
Dynamic Parameter Adjustment: Dynamically adjust parameter a based on volatility changes, increasing parameter values in high volatility environments and decreasing parameter values in low volatility environments. This can better adapt to different market states and improve strategy robustness.
-
Add Volume Filters: Combine volume indicators to evaluate signal strength, only executing trades when volume confirms, increasing signal reliability. This is because breakouts supported by volume are typically more reliable.
-
Implement Partial Position Management: Instead of always entering and exiting with full positions, implement a strategy of building and closing positions in batches, adjusting position size based on signal strength to reduce risk per trade.
-
Add Profit Targets: Set dynamic profit targets based on ATR, partially closing positions when specific profit levels are reached to lock in profits. This can protect existing profits while not giving up potential returns from major trends.
-
Add Time Filters: Avoid specific inefficient trading sessions (such as low liquidity Asian sessions) or pause trading before major data releases to reduce risks from abnormal fluctuations.
-
Market State Adaptation: Add market state (trend/oscillation) judgment logic, adopting different trading strategies or parameter settings in different market states to improve strategy adaptability.
Summary
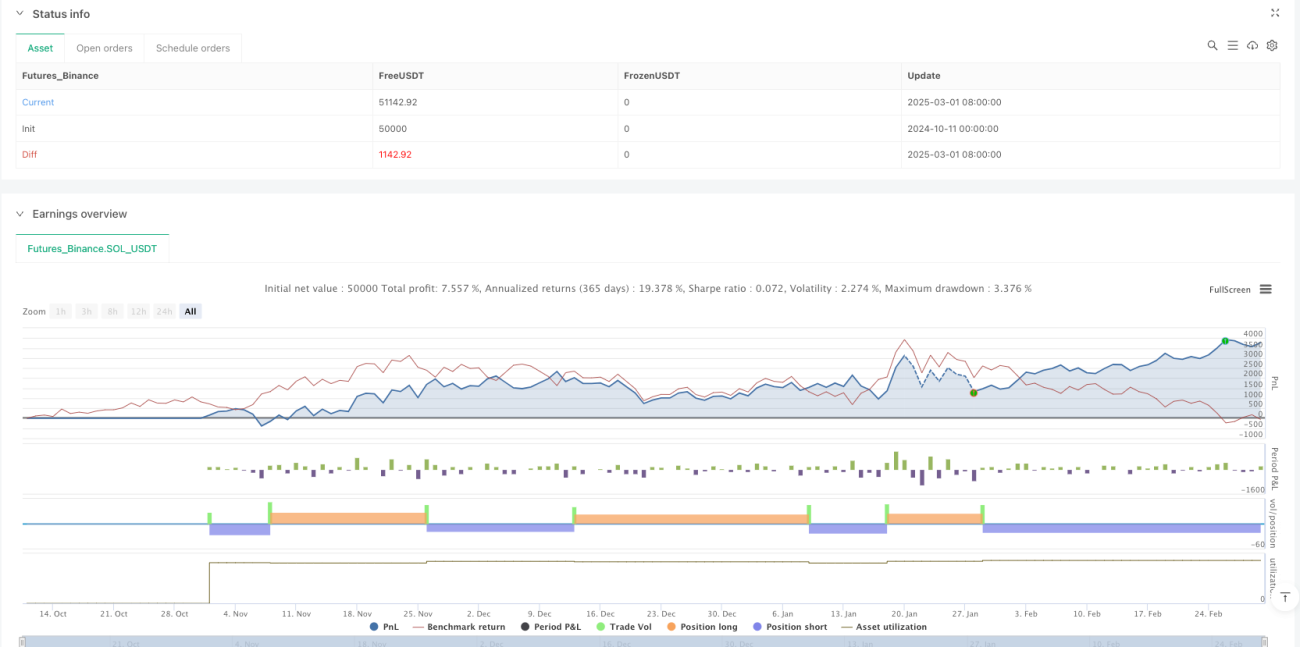
The Dynamic ATR Trailing Stop Trading Strategy is a flexible and fully-featured quantitative trading system that achieves market volatility adaptive trend following functionality by using the ATR indicator to dynamically adjust trailing stop levels. The greatest advantage of this strategy is its ability to automatically adjust risk control parameters based on market conditions, provide clear buy and sell signals, and implement fully automated position management.
Although the strategy may produce false signals in oscillating markets and is sensitive to parameter settings, through adding trend filters, dynamic parameter adjustments, volume confirmation, and partial position management optimization measures, the strategy's robustness and profitability can be significantly improved. This strategy is particularly suitable for medium to long-term trend following traders and investors who wish to automate their trading.
To fully leverage the potential of this strategy, it is recommended that traders conduct thorough historical backtesting, optimize parameter settings for different markets and timeframes, and combine good money management principles to control risk per trade. Through these steps, the Dynamic ATR Trailing Stop Trading Strategy can become a powerful weapon in a trader's toolbox, helping to achieve a more disciplined and systematic trading process.
/*backtest
start: 2024-10-11 00:00:00
end: 2025-03-02 08:00:00
period: 1d
basePeriod: 1d
exchanges: [{"eid":"Futures_Binance","currency":"SOL_USDT"}]
*/

//@version=5
strategy(title='Xfera Trading Bot Automation', overlay=true, default_qty_type=strategy.percent_of_equity, default_qty_value=10)

// Inputs- 1