
Strategy Overview
This strategy is a trading system based on multiple-period moving averages, trend identification, and volume analysis. The core idea is to identify dense zones formed by short-term and mid-term moving averages, confirm trend direction using long-term moving averages, enter trades when price pulls back to the dense zone after a breakout, and manage risk using ATR dynamic stop loss and trailing profit mechanisms. The strategy optimizes traditional moving average systems by adding volume filtering, trend filtering, and precise pullback entry conditions, making trading signals more reliable.
Strategy Principles
The core principles of this strategy are based on the following key components:
-
Moving Average Dense Zone Identification: The strategy uses 20-day (short-term) and 60-day (mid-term) moving averages to form a dense zone, which typically represents the consensus value area of market participants and has certain support or resistance effects.
-
Trend Direction Confirmation: The overall trend direction is determined by comparing the relative positions of the 60-day (mid-term) and 120-day (long-term) moving averages. When the mid-term moving average is above the long-term moving average, it is identified as an uptrend; otherwise, it is a downtrend.
-
Pullback Entry After Breakout: The unique aspect of the strategy is that it doesn't enter directly at the breakout point but waits for the price to pull back to the dense zone after breaking out, which can effectively reduce the risk of false breakouts.
-
Volume Confirmation: Entry signals require volume to exceed 1.5 times the 20-day average volume, ensuring sufficient market participation to support price movement.
-
Risk Management: The strategy uses ATR-based dynamic stop loss and trailing profit mechanisms, allowing stop loss and profit levels to automatically adjust according to market volatility, adapting to different market environments.
From the code implementation, the long entry conditions are: the previous day's price breaks above the upper boundary of the dense zone (maximum of smaShort and smaMid), the current day's price pulls back but remains within the dense zone (not below the lower boundary), the mid-term trend is up (smaMid > smaLong), and volume conditions are met. Short entry conditions are the opposite.
Strategy Advantages
Through in-depth analysis of the strategy's code implementation, the following advantages can be summarized:
-
Multi-level Confirmation Mechanism: The strategy comprehensively considers moving average indicators from short, medium, and long time periods, combined with price action and volume, forming a multi-level signal confirmation mechanism that effectively reduces misjudgment rates.
-
Pullback Entry Reduces Risk: Unlike traditional breakout strategies that enter directly at the breakout point, this strategy waits for pullbacks to enter, obtaining better entry prices and reducing trading costs and risks.
-
Trend Filtering Improves Win Rate: By determining major trend direction through the relationship between mid and long-term moving averages, trading only when the trend direction is clear avoids losses from frequent trading in oscillating markets.
-
Dynamic Risk Management: ATR-based stop loss and trailing profit mechanisms automatically adjust protection positions based on market volatility, protecting profits while giving price sufficient breathing room.
-
Volume Confirmation Enhances Reliability: By requiring volume greater than 1.5 times the average level, trades occur during periods of high market activity, reducing misjudgments in low-liquidity environments.
-
Strong Parameter Adjustability: The strategy provides multiple adjustable parameters, such as moving average periods, ATR multiples, volume thresholds, allowing traders to make flexible adjustments based on different market environments and trading preferences.
Strategy Risks
Despite the comprehensive design of this strategy, there are still the following potential risks:
-
Moving Average Lag: Moving averages are inherently lagging indicators and may not reflect price changes in a timely manner in violently fluctuating markets, leading to delayed entry or exit signals. The solution is to consider shortening moving average periods in high-volatility markets or combining with other leading indicators to assist decision-making.
-
Frequent False Breakouts: In sideways oscillating markets, prices may frequently break through the dense zone and then return, leading to frequent trading and accumulated losses. It is recommended to add additional filtering conditions, such as requiring breakout amplitude to reach a certain percentage, or combining support and resistance level analysis.
-
Stop Loss Range Setting Risk: Fixed multiple ATR stops may be too loose or too tight in different market environments. The ATR multiple parameter should be adjusted based on the volatility characteristics of the specific instrument and historical backtesting results.
-
Over-reliance on Volume: Volume data in some markets may not be transparent or accurate enough, and over-reliance on volume conditions may cause missed valid signals. Consider setting volume conditions as optional or combining with price action analysis.
-
Parameter Optimization Overfitting: Multi-parameter systems are prone to overfitting traps, performing well on historical data but poorly in live trading. It is recommended to use Walk-Forward Analysis to verify strategy stability across different time periods.
Strategy Optimization Directions
Based on code analysis, the strategy can be optimized in the following directions:
-
Add Timeframe Filtering: Consider adding larger timeframe trend confirmation to ensure trading direction is consistent with larger cycle trends. This is because larger cycle trends typically have stronger persistence and reliability.
-
Introduce Price Volatility Adaptive Mechanism: Automatically adjust moving average periods and ATR multiples based on recent market volatility, maintaining good performance in different market environments. In high-volatility markets, appropriately extend moving average periods to reduce signal frequency; in low-volatility markets, appropriately shorten moving average periods to increase sensitivity.
-
Add Seasonality and Time Filtering: Some markets have obvious seasonal characteristics or intraday time effects. Adding time filtering conditions can avoid historically poor-performing time periods.
-
Optimize Pullback Confirmation Logic: Current pullback confirmation is only based on whether the price is within the dense zone. Consider adding more refined pullback depth requirements, such as requiring pullbacks to specific percentage positions in the dense zone (e.g., 38.2%, 50% retracement levels), or combining candlestick patterns to confirm the end of pullbacks.
-
Add Money Management Module: The current strategy uses fixed quantity trading. It can be improved to dynamic position management based on account size and risk proportion, such as fixed risk proportion or Kelly formula, to optimize equity curve and maximum drawdown control.
-
Add Market Environment Recognition: Add classification recognition of market environments (trending/oscillating markets) and adopt different parameter settings or even different trading strategies in different market environments, avoiding frequent trading in unsuitable market environments.
Summary
The "Multi-MA Trend Breakout Pullback System with ATR Dynamic Stop Loss" is a quantitative trading strategy that combines multiple mature concepts in technical analysis. It identifies value zones through moving average dense zones, determines trend direction using moving average systems, and builds a relatively complete trading system by combining breakout pullback price action and volume confirmation. The strategy's advantages lie in its multi-level signal confirmation mechanism and flexible risk management system, suitable for medium to long-term trend-following trading.
In practical application, this strategy needs to pay attention to the lagging problem of moving average systems and the risk of overfitting in parameter optimization. There is considerable room for improvement through adding adaptive mechanisms, market environment recognition, and more refined pullback confirmation logic. Additionally, combining with a more complete money management system will further enhance the strategy's stability and long-term profitability.
Overall, this is a reasonably designed trading system with clear logic, reflecting the core trading philosophy of "trend following + dynamic risk management," suitable for experienced traders to apply in markets with clear trends.
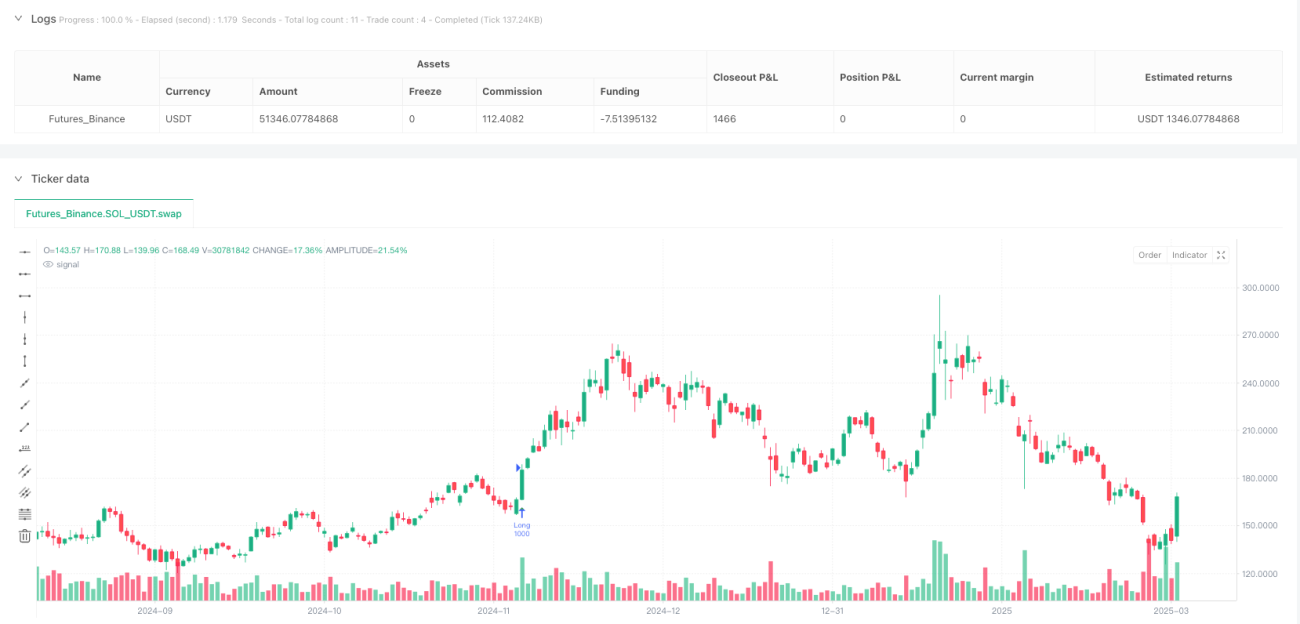
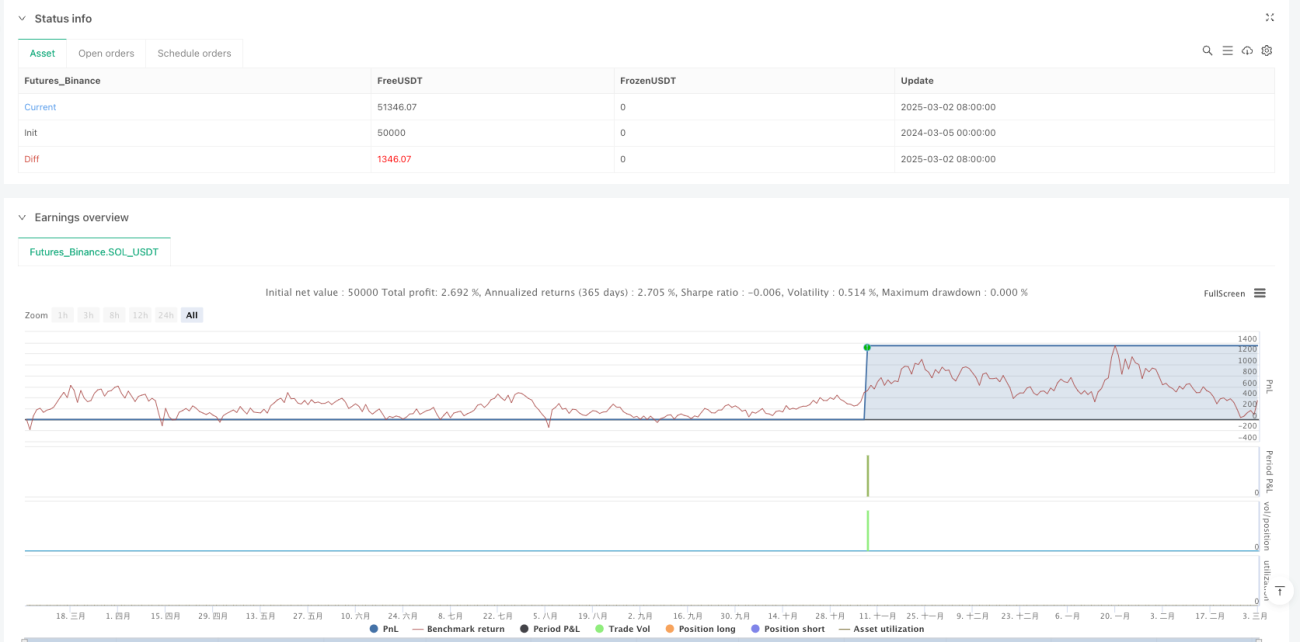
/*backtest
start: 2024-03-05 00:00:00
end: 2025-03-03 08:00:00
period: 1d
basePeriod: 1d
exchanges: [{"eid":"Futures_Binance","currency":"SOL_USDT"}]
*/

//@version=5
strategy("均线密集区交易系统(优化版2)", shorttitle="MA_Zone_Opt2", overlay=true, initial_capital=10000, default_qty_type=strategy.fixed, default_qty_value=1000, commission_value=0.1)

// === 输入参数 ===- 1