# Overview
This is a quantitative trading strategy based on multiple indicator confirmations, with the SuperTrend indicator as the core component, combined with the 200-day Exponential Moving Average (EMA) for trend confirmation, Relative Strength Index (RSI) for momentum confirmation, and Average True Range (ATR) for dynamically setting stop-loss and take-profit levels. The strategy employs a multi-layered filtering mechanism to ensure the reliability of trading signals while protecting capital through a flexible risk management system. The strategy design follows trend-following principles, using multiple indicators for collaborative verification to improve trade success rates.
Strategy Principles
The core principle of this strategy is to filter out low-quality trading signals through multi-layered indicator confirmation while dynamically managing risk:
SuperTrend Signal Identification:
- Uses the SuperTrend indicator (an ATR-based trend-following indicator) to identify price breakouts
- Generates basic buy signals when price breaks above the SuperTrend line
- Generates basic sell signals when price breaks below the SuperTrend line
Trend Confirmation Mechanism:
- Uses 200-day EMA to confirm medium to long-term trend direction
- Buy conditions require price to be above the EMA, ensuring alignment with uptrends
- Sell conditions require price to be below the EMA, ensuring alignment with downtrends
Momentum Confirmation Filter:
- Verifies market momentum using the RSI indicator
- Buy signals require RSI greater than 50, confirming upward momentum
- Sell signals require RSI less than 50, confirming downward momentum
- RSI filtering can be optionally enabled or disabled
Dynamic Risk Management:
- Dynamically sets stop-loss positions based on ATR, adapting to market volatility
- Buy trade stop-loss is set at: Current price - (ATR multiplier × ATR value)
- Sell trade stop-loss is set at: Current price + (ATR multiplier × ATR value)
Risk-Reward Ratio Control:
- Sets take-profit targets using a fixed multiplier relationship
- Take-profit levels are automatically calculated based on stop-loss distance, with a default risk-reward ratio of 1:2
The strategy’s trading logic is clear: trades are executed only when SuperTrend gives a signal and simultaneously meets trend direction (EMA) and market momentum (optional RSI) conditions. After entry, the system automatically sets stop-loss and take-profit levels based on current market volatility, ensuring effective risk management.
Strategy Advantages
Multiple Confirmation Filtering Mechanism:
- Effectively reduces false signals through triple confirmation with SuperTrend, EMA, and RSI
- Multi-layered filtering ensures trading only in high-probability trend environments
- Significantly reduces losing trades in choppy markets
Adaptation to Market Volatility:
- ATR-based stop-loss settings automatically adapt to volatility in different market conditions
- Automatically widens stop-loss distance during high volatility periods and narrows it during low volatility periods
- Avoids the problems of premature exits or excessive risk caused by fixed stop-losses
Comprehensive Risk Management:
- Automatically sets stop-loss and take-profit for each trade, eliminating the need for manual monitoring
- Ensures favorable risk-reward ratios through proportional control (default 1:2)
- Systematic risk control reduces emotional interference
Flexible Strategy Parameters:
- All key parameters can be customized to adapt to different markets and personal risk preferences
- RSI filtering can be optionally enabled or disabled to adjust strategy strictness
- ATR multipliers and take-profit ratios can be optimized according to different market characteristics
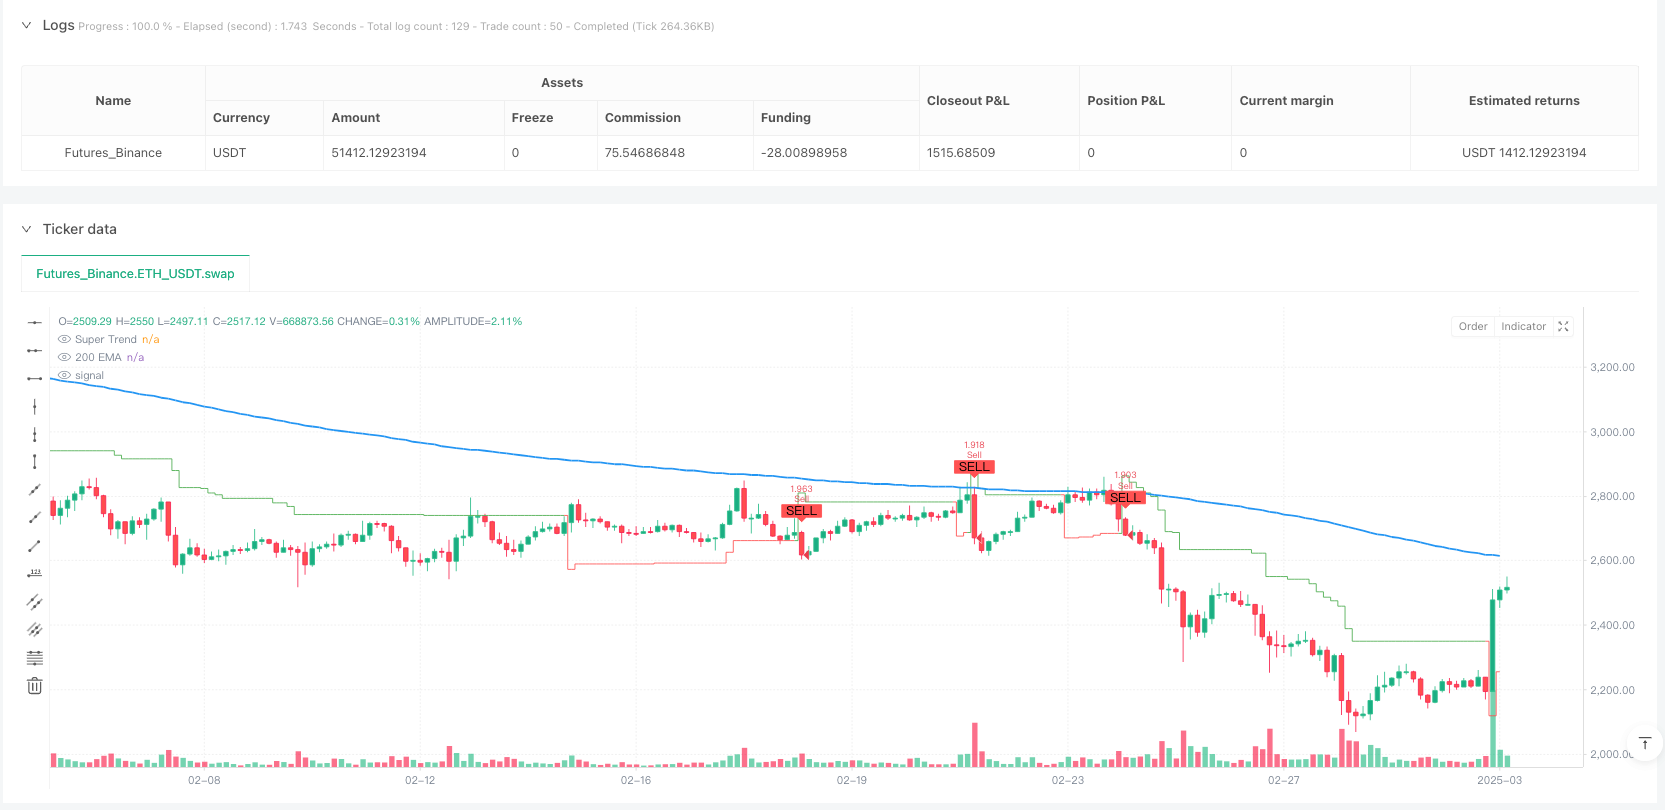
Visualization of Trading Signals:
- Strategy provides clear graphical indicators and trade signal markers
- SuperTrend line color changes intuitively display market trend status
- Buy and sell signals are clearly marked with arrows for backtesting analysis
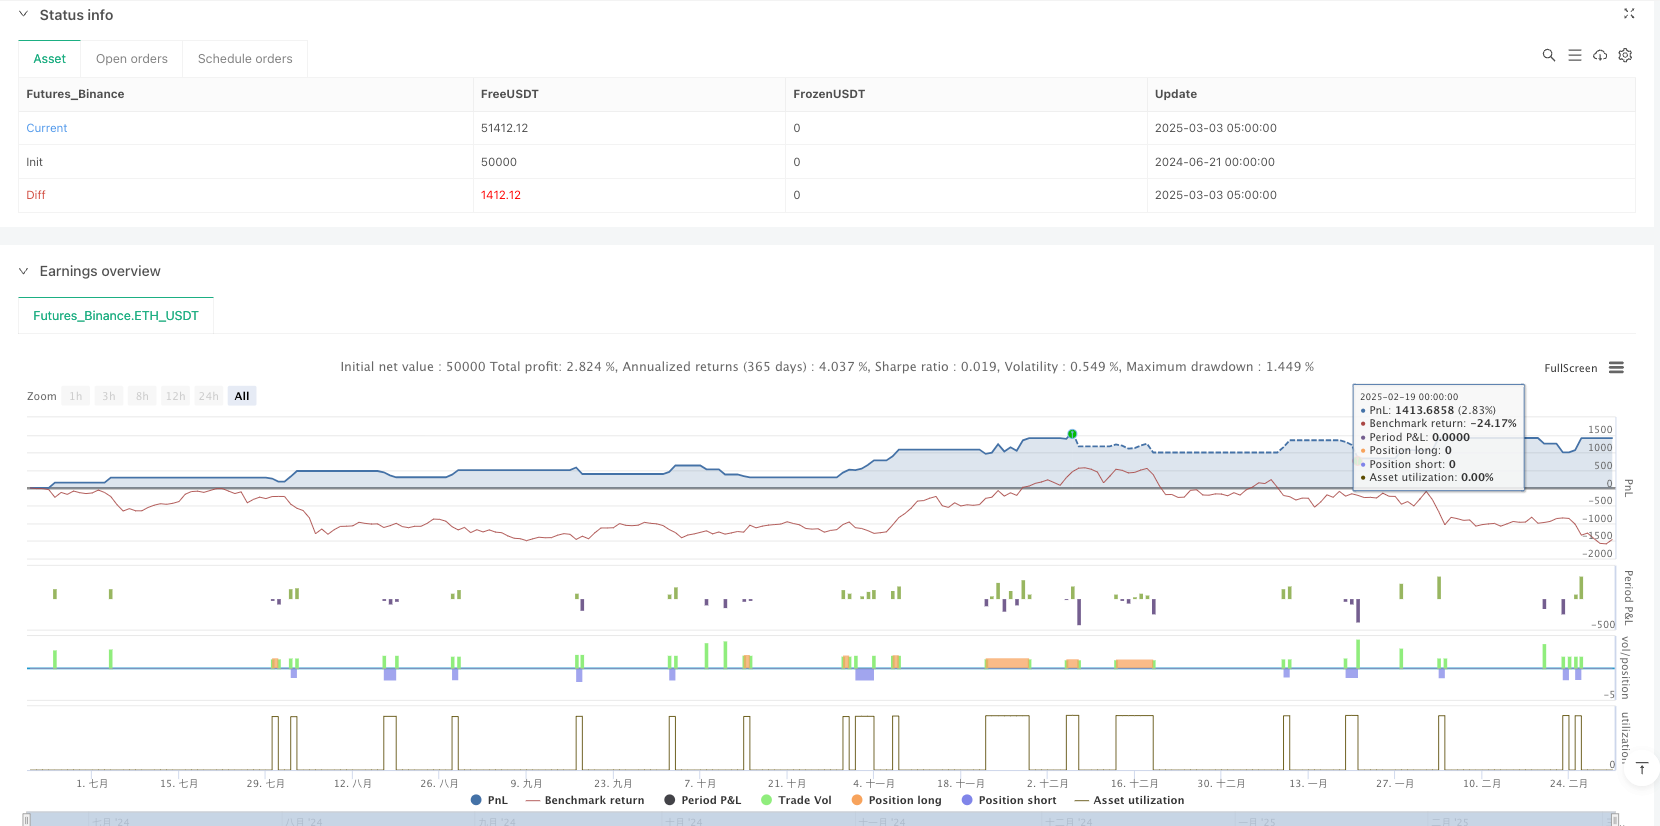
Rational Capital Management:
- By default, each trade uses a fixed percentage of the account equity (10%) rather than a fixed contract quantity
- Position sizes automatically adjust with changes in account size, achieving compound growth
- Avoids potential capital management issues associated with fixed lot trading
Strategy Risks
Delayed Reaction at Trend Reversal Points:
- Both SuperTrend and EMA are lagging indicators that may not respond promptly at trend reversal points
- May face significant drawdowns in rapidly reversing markets
- Mitigation: Consider adding short-term momentum indicators or volatility breakout detection mechanisms
Poor Performance in Sideways Markets:
- The strategy design is based on trend-following principles and may result in frequent entries and exits in sideways markets with no clear trend
- May produce consecutive losing trades in choppy markets
- Mitigation: Add trend strength filtering or pause trading when sideways markets are identified
Limitations of Fixed RSI Threshold:
- Using a fixed RSI threshold (50) may not be suitable for all market environments
- In certain biased markets, RSI may remain in high or low zones for extended periods
- Mitigation: Consider using adaptive RSI thresholds or RSI rate of change rather than absolute levels
Stop-Loss Setting Risks:
- Although dynamic stop-losses based on ATR have advantages, they may be set too wide in extremely volatile markets
- Black swan events may directly breach stop-loss levels
- Mitigation: Add maximum stop-loss limits or implement volatility anomaly detection mechanisms
Over-Optimization Risk:
- The strategy has multiple adjustable parameters, creating a risk of overfitting historical data
- Optimized parameter combinations may not be applicable to future markets
- Mitigation: Use step-forward testing or segmented validation to ensure parameter robustness
Capital Management Considerations:
- Using a default 10% account equity per trade may be too risky in some situations
- Consecutive losses could significantly impact capital
- Mitigation: Adjust position sizing based on strategy backtest performance and personal risk tolerance
Strategy Optimization Directions
Enhance Market Environment Adaptability:
- Develop market type identification functionality to distinguish between trending and ranging markets
- Dynamically adjust trading parameters in different market environments
- Rationale: Improve strategy adaptability across various market conditions and reduce false signals in ranging markets
Implement Dynamic Parameter Adjustments:
- Automatically adjust SuperTrend factors based on market volatility
- Increase factor values in high-volatility markets and decrease them in low-volatility markets
- Rationale: Avoid limitations of fixed parameters and improve strategy responsiveness to market changes
Optimize RSI Application Method:
- Replace fixed RSI thresholds with dynamic thresholds or trendline breakouts
- Consider RSI divergence signals as auxiliary indicators
- Rationale: Enhance RSI indicator effectiveness across different market environments and increase strategy robustness
Enhance Risk Management System:
- Add maximum drawdown control
- Implement volatility-based dynamic position sizing
- Introduce compound stop-loss strategies (trailing stops + fixed stops)
- Rationale: Multi-level risk control can better protect capital and improve long-term survival ability
Add Time Filtering Mechanism:
- Add trading time window restrictions to avoid low liquidity periods
- Consider intraday volatility pattern analysis
- Rationale: Avoid generating signals during unfavorable trading sessions, improve execution quality, and reduce slippage
Enhance Signal Quality Assessment:
- Develop a signal strength scoring system integrating multiple indicators
- Dynamically adjust position sizes based on signal quality
- Rationale: Differentiate between high and low-quality signals and improve capital allocation efficiency
Consider Adding Machine Learning Components:
- Use machine learning methods to optimize parameter combinations
- Explore using neural networks to predict signal reliability
- Rationale: Modern algorithms can uncover market patterns that traditional technical indicators cannot capture
Summary
The Multi-Indicator Trend Confirmation Dynamic Risk Management Trading Strategy is a well-structured, logically sound quantitative trading system. It forms reliable trading signals through triple confirmation with SuperTrend, EMA, and RSI indicators, while controlling risk for each trade using an ATR-based dynamic risk management mechanism.
The core advantages of this strategy lie in its multi-layered filtering mechanism that reduces false signals, adaptive stop-loss settings that handle different market volatility environments, and comprehensive risk management system that ensures capital protection. The strategy parameters are designed to be flexible and adjustable, allowing users to customize according to different market characteristics and personal risk preferences.
However, the strategy also has inherent risks such as delayed reactions at trend reversal points and poor performance in sideways markets. Future optimization directions may include adding market environment identification functionality, implementing dynamic parameter adjustments, improving RSI application methods, enhancing the risk management system, and adding signal quality assessment mechanisms.
Overall, this is a comprehensive strategy system that balances signal quality and risk control, suitable for traders who prefer trend following. Through continuous optimization and improvement, this strategy has the potential to become a long-term, consistently profitable trading system.
/*backtest
start: 2024-06-21 00:00:00
end: 2025-03-03 08:00:00
period: 3h
basePeriod: 3h
exchanges: [{"eid":"Futures_Binance","currency":"ETH_USDT"}]
*/

//@version=6
strategy("Super Trend with EMA, RSI & Signals", overlay=true, default_qty_type=strategy.percent_of_equity, default_qty_value=10)

// Super Trend Indicator
atrLength = input.int(10, title="ATR Length")
factor = input.float(3.0, title="Super Trend Multiplier")
[st, direction] = ta.supertrend(factor, atrLength)

// 200 EMA for Trend Confirmation
emaLength = input.int(200, title="EMA Length")
ema200 = ta.ema(close, emaLength)

// RSI for Momentum Confirmation
rsiLength = input.int(14, title="RSI Length")
rsi = ta.rsi(close, rsiLength)
useRSIFilter = input.bool(true, title="Use RSI Filter?")
rsiThreshold = 50

// Buy & Sell Conditions
buyCondition = ta.crossover(close, st) and close > ema200 and (not useRSIFilter or rsi > rsiThreshold)
sellCondition = ta.crossunder(close, st) and close < ema200 and (not useRSIFilter or rsi < rsiThreshold)

// Stop Loss & Take Profit (Based on ATR)
atrMultiplier = input.float(1.5, title="ATR Stop Loss Multiplier")
atrValue = ta.atr(atrLength)
stopLossBuy = close - (atrMultiplier * atrValue)
stopLossSell = close + (atrMultiplier * atrValue)
takeProfitMultiplier = input.float(2.0, title="Take Profit Multiplier")
takeProfitBuy = close + (takeProfitMultiplier * (close - stopLossBuy))
takeProfitSell = close - (takeProfitMultiplier * (stopLossSell - close))

// Execute Trades
if buyCondition
    strategy.entry("Buy", strategy.long)
    strategy.exit("Take Profit Buy", from_entry="Buy", limit=takeProfitBuy, stop=stopLossBuy)

if sellCondition
    strategy.entry("Sell", strategy.short)
    strategy.exit("Take Profit Sell", from_entry="Sell", limit=takeProfitSell, stop=stopLossSell)

// Plot Indicators
plot(ema200, title="200 EMA", color=color.blue, linewidth=2)
plot(st, title="Super Trend", color=(direction == 1 ? color.green : color.red), style=plot.style_stepline)

// Plot Buy & Sell Signals as Arrows
plotshape(series=buyCondition, location=location.belowbar, color=color.green, style=shape.labelup, title="Buy Signal", text="BUY")
plotshape(series=sellCondition, location=location.abovebar, color=color.red, style=shape.labeldown, title="Sell Signal", text="SELL")