
Overview
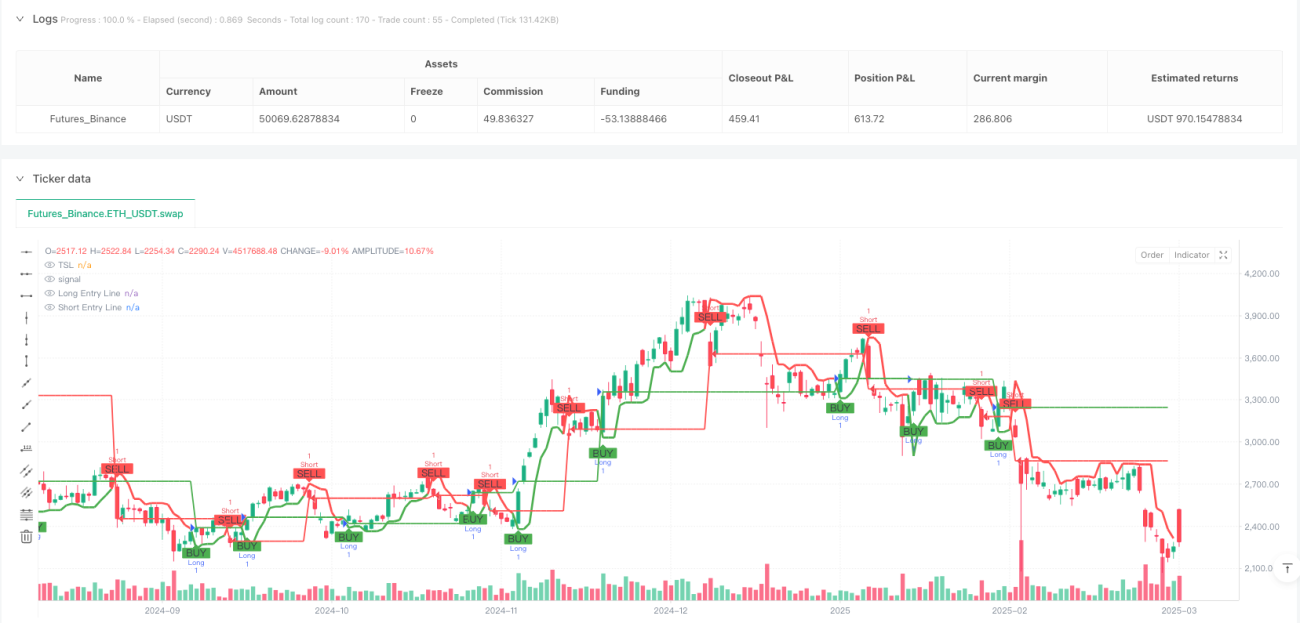
The Multi-Directional Oscillator Trading System is a quantitative trading strategy based on technical analysis, primarily relying on the identification of swing highs and lows to determine market trend changes. The strategy tracks the highest high and lowest low over N periods to construct a dynamic Trailing Stop Level (TSL), which serves as a decision boundary for both long and short trades. The system automatically executes buy signals when the price breaks above the TSL and sell signals when the price falls below the TSL, while managing positions to ensure only one directional position is held at any time. This strategy is particularly suitable for volatile market environments, capable of automatically capturing short to medium-term trend changes.
Strategy Principles
The core logic of this strategy revolves around the Trailing Stop Level (TSL), implemented as follows:
-
Calculate key price levels within the period:
- Use
ta.highest(high, no)to calculate the highest price (res) over the past no periods - Use
ta.lowest(low, no)to calculate the lowest price (sup) over the past no periods
- Use
-
Determine price position relative to previous highs and lows:
- When the closing price is higher than the previous period's highest price, avd is set to 1 (uptrend)
- When the closing price is lower than the previous period's lowest price, avd is set to -1 (downtrend)
- In other cases, avd is set to 0 (no clear trend)
-
Construct the Trailing Stop Level (TSL):
- During an uptrend, TSL is set to the support level (sup) as a stop-loss point
- During a downtrend, TSL is set to the resistance level (res) as a reversal signal point
-
Generate trading signals:
- Buy signal (Buy): When the closing price crosses above the TSL
- Sell signal (Sell): When the closing price crosses below the TSL
-
Execute trading operations:
- When a buy signal is triggered, close short positions and open long positions
- When a sell signal is triggered, close long positions and open short positions
The system also includes visualization components, such as markers for buy and sell points, color-changing candlesticks and background, and horizontal lines displaying entry prices in real-time, enhancing the visual experience of the trading process.
Strategy Advantages
-
Strong trend capture capability: Through dynamic calculation of the highest and lowest prices, it effectively captures market trend changes and adapts to market fluctuations across different cycles.
-
High degree of automation: The system automatically identifies buy and sell signals and executes trades, reducing human intervention and emotional influence.
-
Bi-directional trading mechanism: Supports both long and short trading, enabling profit opportunities in both rising and falling markets.
-
Built-in risk management: The design of the Trailing Stop Level (TSL) inherently includes a stop-loss function, limiting the maximum loss per trade.
-
Visual trading feedback: The graphical interface clearly displays trading signals and entry prices, allowing traders to monitor and evaluate strategy performance in real-time.
-
Parameter flexibility: By adjusting the swing period parameter (no), the strategy can adapt to market characteristics across different time periods, applicable from short-term to medium-long term trading.
-
Clear signal prompts: The system provides both textual and visual signal prompts, reducing the possibility of operational errors.
Strategy Risks
-
Poor performance in ranging markets: In sideways, choppy markets, the strategy may generate frequent false signals, leading to consecutive stop-losses.
-
Slippage and execution delay risks: In live trading, there may be a time gap between signal generation and order execution, causing actual transaction prices to deviate from ideal prices.
-
Fixed position management limitations: The current strategy uses a fixed unit (qty=1) for trading, lacking a mechanism to adjust position size based on market volatility or account size.
-
Parameter sensitivity: Strategy performance highly depends on the swing period parameter (no) setting, with different market environments potentially requiring different parameter values.
-
Weak response to sudden market conditions: During rapid price movements caused by major news or black swan events, the stop level may not adjust quickly enough, resulting in larger losses.
Methods to mitigate these risks include: combining other indicators for signal confirmation, implementing dynamic position management, setting maximum stop-loss limits, adjusting parameters based on volatility, and regularly backtesting and optimizing strategy parameters.
Strategy Optimization Directions
-
Dynamic position management: Dynamically adjust position size based on market volatility or account balance ratio, rather than fixed unit trading. This can be implemented by adding code such as:
volatility = ta.atr(14) / close * 100 // Calculate volatility percentage position_size = strategy.equity * 0.01 / volatility // Adjust position based on volatility -
Signal filtering optimization: Introduce additional technical indicators such as RSI, MACD, or ATR as signal filters to reduce false signals. For example:
rsi = ta.rsi(close, 14) valid_buy = Buy and rsi < 70 // Avoid buying in overbought areas valid_sell = Sell and rsi > 30 // Avoid selling in oversold areas -
Adaptive parameters: Dynamically adjust the swing period parameter (no) based on market volatility, using smaller values in low volatility environments and larger values in high volatility environments.
-
Add profit targets: Set profit targets based on ATR or support/resistance levels to lock in partial profits when the market moves a sufficient distance in the favorable direction.
-
Time filters: Add trading time window restrictions to avoid market sessions with lower liquidity or abnormal volatility.
-
Drawdown control mechanism: Implement a trading pause mechanism based on account equity drawdown percentage, temporarily stopping trading when consecutive losses reach a preset threshold.
-
Multi-timeframe confirmation: Combine with the trend direction of higher timeframes, only opening positions in the direction consistent with the higher timeframe trend to improve win rate.
These optimization directions can significantly enhance the strategy's robustness and adaptability, especially in providing better risk-adjusted returns during transitions between different market environments.
Summary
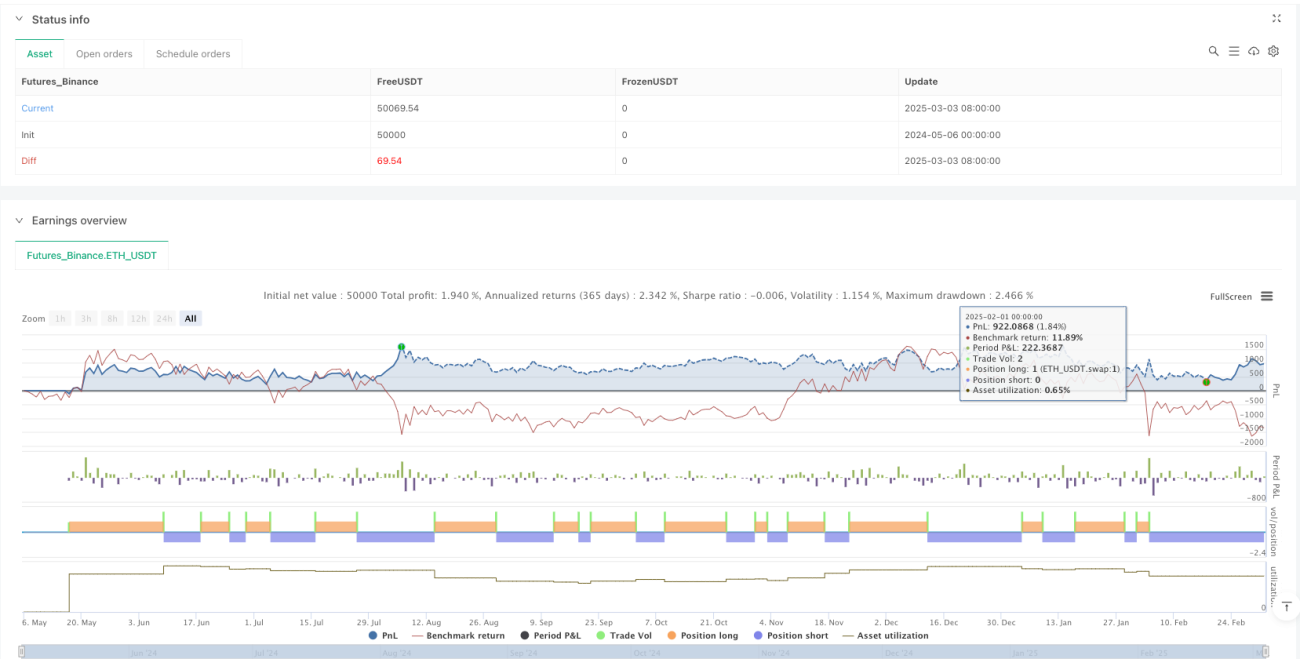
The Multi-Directional Oscillator Trading System is an automated trading strategy based on technical analysis, capturing market trend changes and executing bi-directional trades through a dynamic Trailing Stop Level (TSL). The strategy performs excellently in markets with clear trends, effectively tracking price movements and automatically managing positions.
The core advantages of the strategy lie in its simple yet effective signal generation mechanism and built-in risk management functions, particularly suitable for medium to short-term trend trading. However, the strategy may face challenges with frequent false signals in ranging markets, requiring further optimization to improve its adaptability across various market environments.
By implementing dynamic position management, multi-indicator signal confirmation, adaptive parameter adjustment, and other optimization measures, the strategy can further enhance its risk-adjusted returns and stability. For quantitative traders, this rule-based automated system provides a reliable framework that can reduce emotional interference and maintain trading discipline.
Ultimately, the successful application of this strategy depends on the trader's fine-tuning of parameter settings and understanding of market characteristics. It is recommended to conduct thorough historical backtesting and simulated trading verification before applying it to live trading.
- 1