
Overview
The TMA Strategy is a trend-following trading system that cleverly combines multiple-period Smoothed Moving Averages (SMMA) with candlestick pattern analysis to identify high-probability trading opportunities. The strategy employs 21, 50, 100, and 200-period smoothed moving averages as the foundation for trend identification and support/resistance zones, while utilizing the "3-line strike" and "engulfing pattern" classic candlestick formations to confirm entry signals. To reduce false signals and ensure trade direction aligns with the dominant trend, the strategy also incorporates a 2-period Exponential Moving Average (EMA) as a dynamic trend filter. Additionally, the strategy provides a customizable trading session filter function, allowing traders to choose to execute trades within specific market sessions (such as New York, London, Tokyo, etc.) to ensure transactions occur during high-liquidity time periods.
Strategy Principles
The core logic of the TMA Strategy revolves around multiple-period smoothed moving averages, candlestick pattern confirmation, and trading session filtering. First, the strategy calculates four different period (21, 50, 100, and 200) smoothed moving averages, which together form the framework of market trends. Second, the strategy uses a 2-period EMA as a short-term trend indicator to determine current price direction.
Entry conditions are designed to be very strict, requiring multiple conditions to be met simultaneously:
- For long entries: A bullish engulfing pattern or 3-line strike pattern must appear; price must be above the 200-period SMMA; the 2-period EMA must confirm an uptrend.
- For short entries: A bearish engulfing pattern or 3-line strike pattern must appear; price must be below the 200-period SMMA; the 2-period EMA must confirm a downtrend.
Furthermore, if the trading session filter is enabled, the entry operation must be executed within the specified trading session. This multi-layered condition filtering design effectively reduces the generation of erroneous signals.
Exit conditions are relatively straightforward:
- Long positions are closed when the 2-period EMA crosses below the 200-period SMMA.
- Short positions are closed when the 2-period EMA crosses above the 200-period SMMA.
This design allows trends to fully develop while exiting at the early stages of trend reversal, effectively protecting profits already gained.
Strategy Advantages
The TMA Strategy has multiple advantages that make it a powerful trend-following tool:
-
Multi-layer Trend Confirmation: By combining multiple periods of smoothed moving averages, the strategy can comprehensively assess the strength and persistence of market trends, reducing potential misleading signals from a single indicator.
-
Candlestick Pattern Confirmation: The strategy relies not only on technical indicators but also incorporates classic candlestick pattern analysis, and this dual confirmation mechanism significantly improves the reliability of entry signals.
-
Strong Adaptability: Adjustable parameter settings (such as moving average periods, trading session times, etc.) allow the strategy to adapt to different markets and trading styles.
-
Comprehensive Risk Management: Clear exit conditions based on moving average crossovers provide traders with an objective risk control mechanism, avoiding excessive position holding that might result from subjective judgment.
-
Liquidity Management: Through the trading session filter, the strategy can avoid low liquidity periods, reducing slippage and price manipulation risks.
-
Noise Reduction: The use of smoothed moving averages reduces the impact of market noise, making trend signals clearer.
-
Multi-market Applicability: The strategy design is applicable to various markets such as forex, stocks, and cryptocurrencies, particularly effective on higher timeframes (15-minute, 1-hour, 4-hour, daily).
Strategy Risks
Despite its many advantages, the TMA Strategy also has some potential risks that need attention:
-
Delayed Trend Identification: Due to the use of moving averages as the main indicator, signals of trend changes may be relatively lagging, missing part of the profits in the early stages of trends. Solution: Consider combining more sensitive indicators (such as MACD or RSI) to identify potential trend changes in advance.
-
Poor Performance in Oscillating Markets: As a trend-following strategy, it may produce consecutive losing trades in sideways or frequently oscillating market environments. Solution: Add a market mode filter that pauses trading or adjusts to parameters suitable for oscillating markets when such conditions are detected.
-
False Breakout Risk: Candlestick patterns such as engulfing patterns and 3-line strikes may produce false signals in some cases. Solution: Additional confirmation conditions can be added, such as volume confirmation or key price level breakout confirmation.
-
Over-optimization Risk: Multiple adjustable parameters may lead to overfitting historical data but perform poorly in future markets. Solution: Conduct thorough backtesting across different markets and time periods, and maintain robustness in parameter settings.
-
Session Filter Timezone Setting: The trading session filter relies on correct timezone settings, and incorrect configuration may lead to trading during inappropriate time periods. Solution: Carefully verify timezone settings to ensure consistency with the active sessions of the target market.
Strategy Optimization Directions
Based on in-depth analysis of the code, the TMA Strategy has the following potential optimization directions:
-
Dynamic Parameter Adjustment: Currently, the strategy uses fixed moving average periods. Consider automatically adjusting these parameters based on market volatility. For example, use longer periods in high-volatility markets to reduce noise and shorter periods in low-volatility markets to increase sensitivity. This would allow the strategy to better adapt to different market conditions.
-
Add Stop Loss Mechanism: The current strategy relies solely on moving average crossovers as exit conditions. Fixed stop loss or trailing stop loss functionality could be added to limit the maximum loss per trade, protecting capital safety.
-
Introduce Volatility Filter: Add volatility indicators (such as ATR or standard deviation) to entry conditions to avoid entering the market during abnormal volatility periods, or dynamically adjust position sizes based on volatility levels for more refined risk management.
-
Optimize Position Management: Consider adjusting position size based on trend strength or signal quality, rather than a fixed percentage of funds. This can increase returns on high-probability trades while reducing risk exposure on low-probability ones.
-
Add Partial Profit-Locking Mechanism: When a trade reaches a certain profit level, consider partial position closure or moving the stop loss to breakeven, locking in some profits while retaining the opportunity to continue participating in the trend.
-
Multi-timeframe Confirmation: Integrate trend analysis from higher timeframes, entering only when the trend direction is consistent with higher timeframes. This can significantly improve success rates and reduce false breakout risks.
Summary
The TMA Strategy is a well-designed trend-following system that provides traders with a systematic approach to identifying and capturing market trends through the combination of multiple-period smoothed moving averages, candlestick pattern confirmation, and dynamic trend filters. The strategy particularly emphasizes confirmation mechanisms, requiring multiple conditions to be met simultaneously before executing trades, effectively reducing the false signal rate.
Although there are some inherent risks, such as delayed trend identification and poor performance in oscillating markets, these risks can be mitigated through the optimization directions proposed in this article. By adding stop loss mechanisms, volatility filters, multi-timeframe confirmation, and other features, the robustness and adaptability of the strategy can be further enhanced.
Finally, it should be emphasized that no trading strategy has a 100% win rate, and the TMA Strategy is no exception. Successful trading depends not only on the strategy itself but also on the trader's discipline, risk management abilities, and understanding of the market. Therefore, it is recommended that traders thoroughly test this strategy in a demo account before live trading, familiarize themselves with its characteristics and limitations, and make appropriate adjustments according to individual risk tolerance and trading objectives.
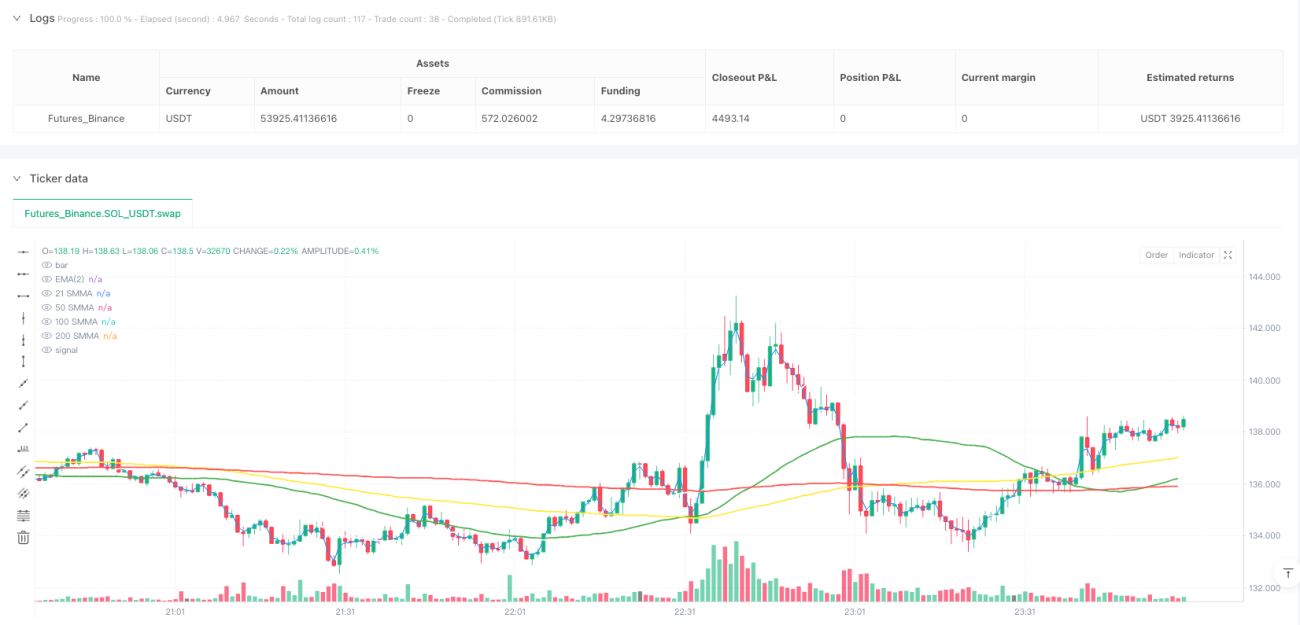
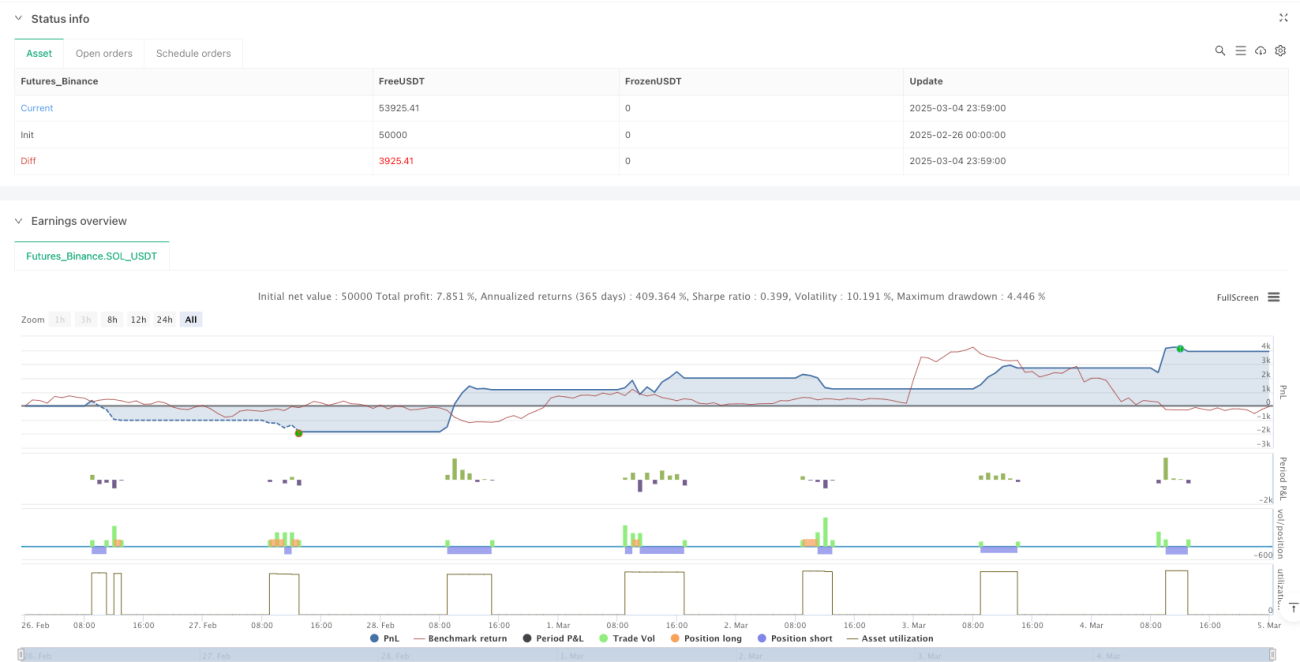
/*backtest
start: 2025-02-26 00:00:00
end: 2025-03-05 00:00:00
period: 1m
basePeriod: 1m
exchanges: [{"eid":"Futures_Binance","currency":"SOL_USDT"}]
*/

//@version=5
strategy("TMA Strategy", shorttitle="TMA Strategy", overlay=true, initial_capital=10000, default_qty_type=strategy.percent_of_equity, default_qty_value=100, commission_type=strategy.commission.percent, commission_value=0.1)

// Smoothed MAs Inputs- 1