
Overview
The Multi-Indicator Adaptive Momentum Crossover Trading System is a comprehensive quantitative trading strategy that cleverly combines multiple technical indicators, including Exponential Moving Average (EMA), Relative Strength Index (RSI), Average True Range (ATR), Average Directional Index (ADX), and On-Balance Volume (OBV). Through the synergistic effect of these indicators, it captures market momentum changes within 30-minute and 1-hour timeframes. The core mechanism of this strategy is based on crossover signals between fast and slow EMAs, with multiple filters to ensure signal quality, while employing dynamic take-profit and stop-loss mechanisms to manage risk and reward.
Strategy Principles
The core principle of this strategy is to identify market trend changes and filter noise signals through comprehensive analysis of technical indicators. The specific implementation is as follows:
-
EMA Crossover Signals: The strategy uses 9-period and 21-period exponential moving averages as the primary signal generation mechanism. When the fast EMA (9-period) crosses above the slow EMA (21-period), a buy signal is generated; when the fast EMA crosses below the slow EMA, a sell signal is generated.
-
Trend Strength Filtering: The strategy confirms market trend strength through the ADX indicator (14-period). Only when the ADX value is greater than the set threshold (default 25) are trading signals considered, ensuring the strategy only trades in definitive trends.
-
Volatility Filtering: Using the ATR indicator (14-period) to measure market volatility, the strategy only trades when volatility exceeds a specific threshold, avoiding false signals in low-volatility consolidating markets.
-
RSI Neutral Zone Filtering: Signals are filtered using the RSI indicator (14-period) to select those with RSI values in the 40-60 range. This neutral zone helps avoid trading in extreme overbought or oversold areas.
-
Volume Confirmation: The strategy uses the OBV (On-Balance Volume) indicator and its 10-period simple moving average to confirm whether price movements are supported by sufficient trading volume.
-
Dynamic Risk Management: Stop-loss (default 1.2 times ATR) and take-profit levels (default 2.5 times ATR) are dynamically calculated based on ATR values, adapting risk management to current market volatility conditions.
Strategy Advantages
-
Multiple Confirmation Mechanisms: The strategy combines multiple technical indicators to form a systematic signal confirmation mechanism, significantly reducing the probability of false signals. Trading signals are only confirmed valid when EMA, ADX, RSI, volatility, and volume indicators all meet the conditions simultaneously.
-
Adaptive Risk Management: Through ATR-based dynamic take-profit and stop-loss settings, the strategy can adjust risk parameters according to actual market volatility, setting wider stops in high-volatility markets and tighter stops in low-volatility markets, maintaining flexibility and effectiveness in risk management.
-
Timeframe Focus: The strategy focuses on 30-minute and 1-hour timeframes. These medium timeframes provide sufficient trading opportunities while avoiding excessive noise from shorter timeframes, achieving a balance between trading frequency and signal quality.
-
Trend and Momentum Combination: By capturing momentum changes through EMA crossovers while using ADX to ensure trading in strong trends, the strategy achieves an organic combination of trend-following and momentum trading strategies.
-
Volume Verification: Unlike many strategies that focus solely on price, this strategy integrates volume analysis through the OBV indicator, providing an additional dimension of market confirmation and enhancing signal reliability.
Strategy Risks
-
Over-Filtering Risk: Multiple filtering conditions may cause the strategy to miss some profitable trading opportunities, especially when market conditions change rapidly. To mitigate this risk, consider dynamically adjusting the strictness of filtering conditions based on different market environments.
-
Parameter Sensitivity: The strategy relies on multiple technical indicators and their parameter settings, making strategy performance relatively sensitive to parameter selection. It is recommended to optimize parameters through backtesting in different market environments or consider implementing parameter adaptive mechanisms.
-
Trend Reversal Risk: Strategies relying on EMA crossovers may react slowly when trends suddenly reverse. Consider adding early warning indicators for trend reversals, such as monitoring the distance between price and EMA or analyzing divergence in momentum indicators.
-
Stop-Loss Breakthrough Risk: In highly volatile markets or during major news releases, prices may quickly break through stop-loss levels, resulting in larger losses. Consider pausing trading during specific high-risk periods or adding additional volatility monitoring mechanisms.
-
Over-Reliance on ADX: ADX as the main trend filter may not be sensitive enough in certain market conditions. Consider combining with other trend confirmation indicators, such as trendline analysis or long-term moving average direction.
Strategy Optimization Directions
-
Dynamic Indicator Periods: Currently, the strategy uses fixed-period technical indicators (such as 14-period RSI, 9/21-period EMA). Consider implementing a dynamic period adjustment mechanism that automatically adjusts indicator periods based on market volatility, using longer periods in high-volatility markets to reduce noise and shorter periods in low-volatility markets to increase sensitivity.
-
Market Environment Classification: Add market environment classification functionality to distinguish between trending markets and range-bound oscillating markets, and apply different trading rules and parameter settings for different market types. For example, stricter ADX thresholds or additional overbought/oversold filters may be needed in oscillating markets.
-
Time Filtering: Implement trading time filters to avoid trading during known low-liquidity or high-volatility periods. This can be done by analyzing historical data to identify optimal trading periods, improving overall success rates.
-
Machine Learning Optimization: Introduce machine learning algorithms to optimize weights for multi-indicator signals, dynamically adjusting the importance of each indicator based on different market conditions, allowing the strategy to better adapt to changing market environments.
-
Take-Profit Strategy Improvement: Consider implementing a phased take-profit strategy, such as moving the stop-loss to breakeven after reaching a certain profit level, or partial position closures to lock in some profits. This may be more effective at capturing major trends than simple fixed-multiplier take-profits.
-
Reverse Signal Validation: Add validation mechanisms for reverse signals. When a buy signal appears, also check the strength of sell conditions, and vice versa. Only execute trades when the strength of reverse signals is relatively low, improving signal quality.
Summary
The Multi-Indicator Adaptive Momentum Crossover Trading System is a comprehensive and well-thought-out quantitative trading strategy that captures market momentum changes in medium timeframes by integrating multiple technical indicators and filtering mechanisms. Its core advantages lie in multi-layered signal confirmation mechanisms and dynamic risk management based on market volatility. Although there are risks such as parameter sensitivity and possible over-filtering, through the suggested optimization directions such as dynamic indicator periods, market environment classification, and machine learning optimization, the adaptability and robustness of the strategy can be further enhanced. This strategy is particularly suitable for traders seeking systematic methods to capture medium-term market trends, especially performing well in market environments with clear trends and moderate volatility.
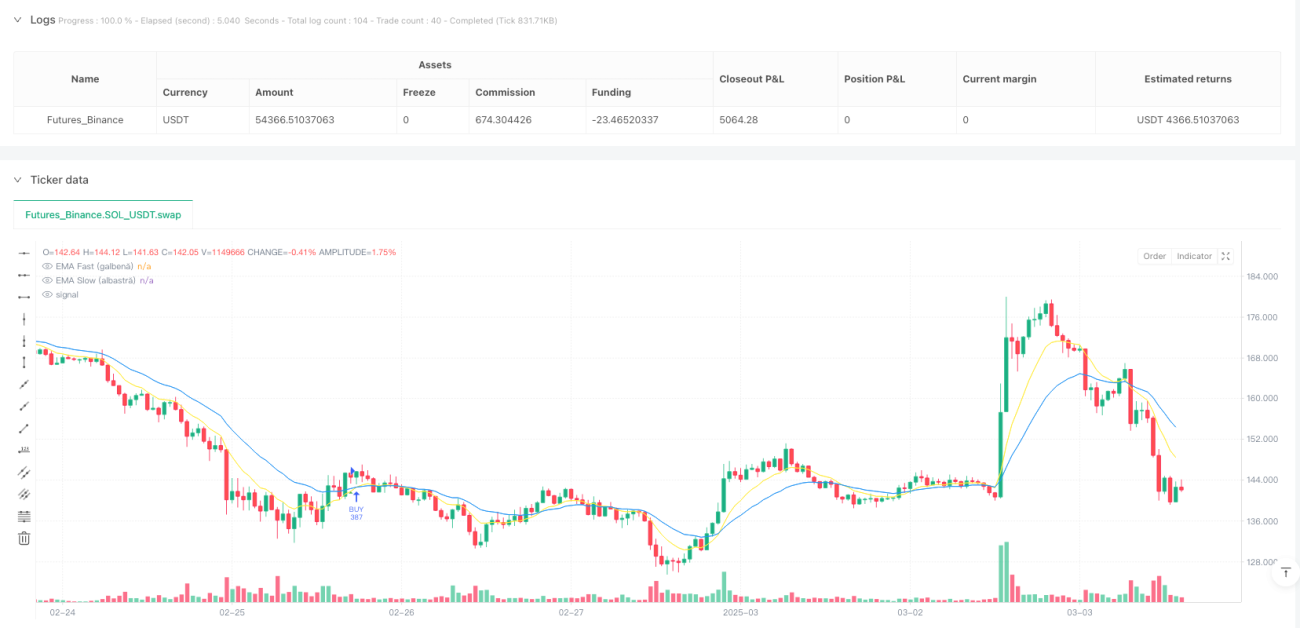
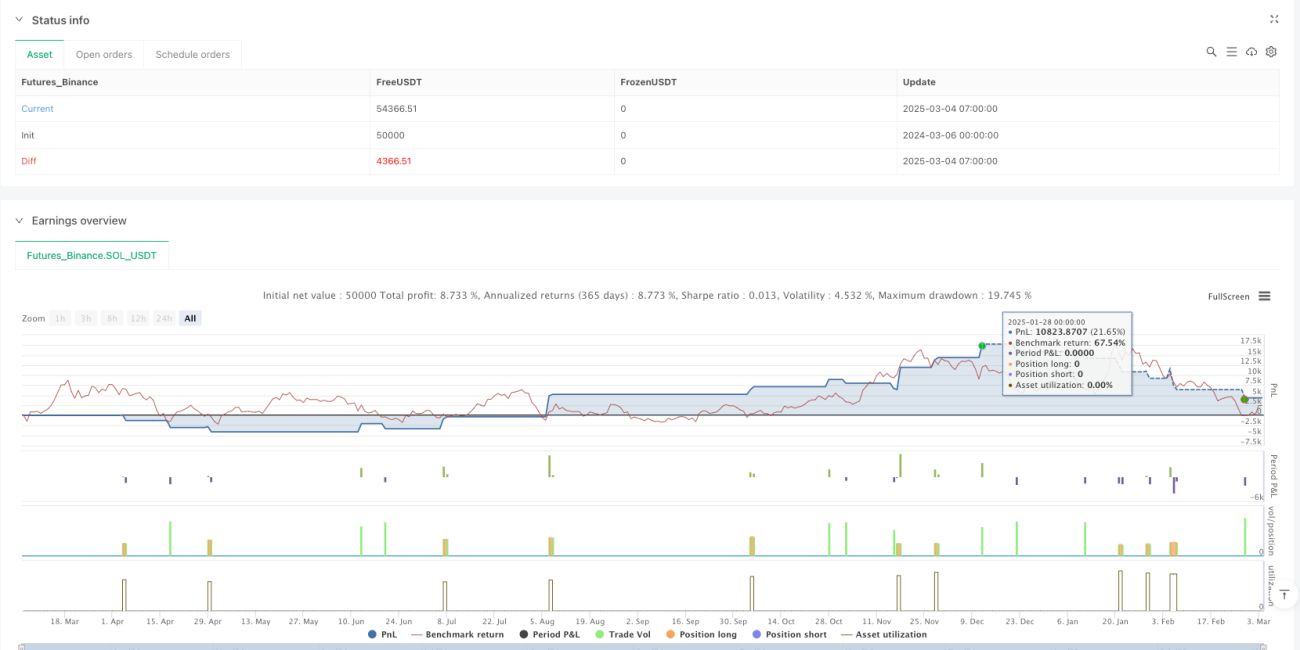
/*backtest
start: 2024-03-06 00:00:00
end: 2025-03-04 08:00:00
period: 1h
basePeriod: 1h
exchanges: [{"eid":"Futures_Binance","currency":"SOL_USDT"}]
*/

//@version=6
strategy("MuSTeaTZa v1.7 🚀", overlay=true, default_qty_type=strategy.percent_of_equity, default_qty_value=100)

// 📌 Verificare Timeframe (30m și 1h)- 1