
Overview
This strategy is a quantitative trading system based on the combination of Exponential Moving Averages (EMA) and Moving Average Convergence Divergence (MACD). The strategy primarily uses the golden cross signal between the 5-day EMA and 20-day EMA as the entry basis, while incorporating the price's position relative to the 30-day EMA and market trading time conditions as filters, forming a complete short-term trading system. The strategy design focuses on trend confirmation and risk control, making trading decisions more objective and disciplined through fixed-amount take-profit and stop-loss settings.
Strategy Principles
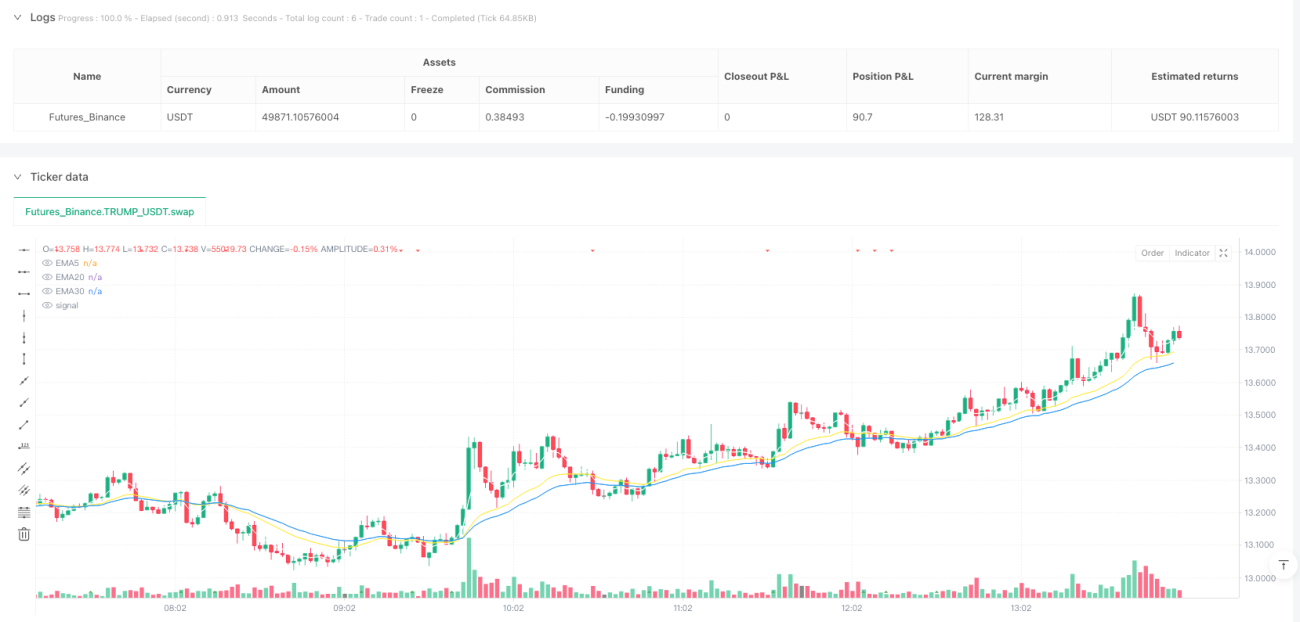
The core logic of this strategy is based on three different period Exponential Moving Averages (5-day, 20-day, and 30-day EMA), judging trend direction by observing their crossover relationships and relative positions. Specifically, when the short-period 5-day EMA crosses above the medium-period 20-day EMA, and the price remains above the long-period 30-day EMA, the system generates a long signal. This design fully considers the principles of multi-timeframe analysis, ensuring that the trading direction remains consistent with the main trend.
Additionally, the strategy incorporates trading time filter conditions, only executing trades during regular trading hours from 9:30 AM to 4:00 PM Eastern Time in the United States. This time filtering mechanism helps to avoid periods of poor market liquidity and abnormal volatility, improving the success rate of trades.
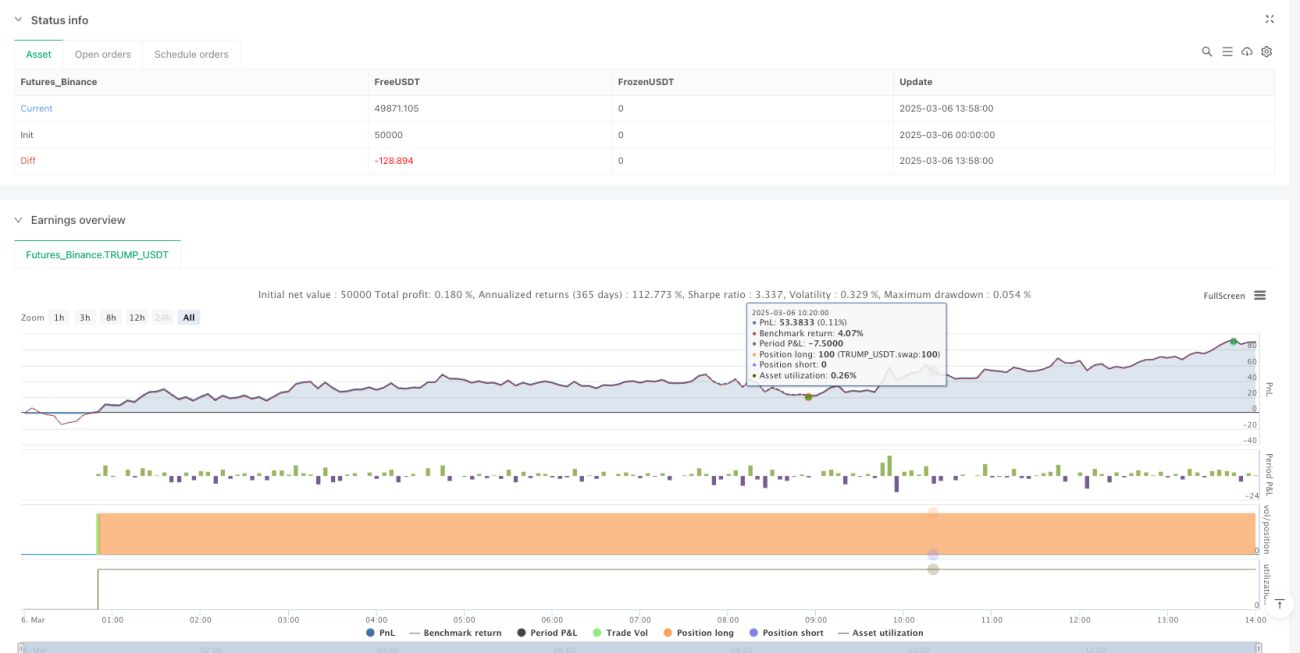
In terms of fund management, the strategy adopts a fixed quantity of positions to enter the market and manages risk through fixed-amount take-profit and stop-loss ratios. The system sets a fixed profit target of $2,000 and a stop-loss level of 1,000 points, which ensures that the risk-reward characteristics of each trade remain consistent, contributing to long-term stable performance.
Strategy Advantages
-
Multiple Confirmation Mechanisms: By combining the synergistic effects of short, medium, and long-period EMAs, the strategy can effectively filter out false breakouts and market noise, ensuring the reliability of trading signals. When the 5-day EMA crosses above the 20-day EMA and the price is above the 30-day EMA, it indicates that short-term, medium-term, and long-term trends are all rising, increasing the probability of successful trades.
-
Precise Market Time Filtering: The strategy only operates during normal trading hours, avoiding limited liquidity periods such as pre-market and after-hours, reducing the possibility of slippage and unfavorable executions. This feature is particularly important for intraday short-term trading and can effectively avoid risks brought by abnormal market volatility.
-
Clear Risk Management Framework: Through fixed-amount take-profit and stop-loss settings, the risk exposure of each trade is strictly controlled. This method is more suitable for specific market environments compared to percentage-based stop-losses, especially in situations of violent price fluctuations, better protecting fund safety.
-
Visualized Trading Signals: The strategy clearly displays EMA crossover points and entry signals through graphic markers, allowing traders to intuitively identify potential trading opportunities and improve decision-making efficiency. These visual aids are valuable for real-time trading monitoring.
-
Concise and Efficient Strategy Logic: Compared to complex multi-indicator systems, this strategy maintains logical simplicity, reducing the risk of overfitting while providing sufficient market insight. The concise design also means less computational burden, suitable for high-frequency trading environments.
Strategy Risks
-
Lagging Nature of Moving Average Crossovers: EMA crossover signals are inherently lagging indicators, which may lead to delayed entry timing in rapidly changing markets, missing the optimal price zones. Especially in highly volatile markets, waiting for confirmation of the 5-day EMA crossing the 20-day EMA may result in entry prices far from the ideal area.
-
Fixed Stop-Loss Risk: The strategy employs a fixed-amount stop-loss rather than dynamically adjusting based on market volatility, which may result in stop-losses that are too tight or too loose when market conditions change. For example, in cases of suddenly expanded volatility, fixed stop-loss points may be easily triggered, causing unnecessary losses.
-
Market Condition Dependency: This strategy performs best in clearly trending markets but may generate frequent false signals in range-bound or highly volatile market environments. When the market lacks directionality, moving average crossovers may lead to consecutive losing trades.
-
Lack of Volume Confirmation: Although there are volume-related signal conditions plotted in the strategy code, trading decisions do not use volume as a filter condition, potentially leading to entries into weak trends in low-volume environments.
-
Single-Direction Trading Limitation: The current strategy design is only optimized for long conditions, lacking complete support for short markets, limiting its application range in bearish market environments.
Strategy Optimization Directions
-
Introduce Dynamic Stop-Loss Mechanism: Stop-loss levels can be dynamically adjusted based on market volatility indicators (such as ATR), making the stop-loss more intelligent and adaptive. For example, the stop-loss can be set as a multiple of ATR, automatically increasing the stop-loss distance during high-volatility periods and tightening it during low-volatility periods.
-
Integrate Volume Conditions: It is recommended to use volume breakouts as an additional confirmation condition, triggering trading signals only when EMA crossovers occur against a background of increased volume. This can be specifically implemented by comparing the relationship between current volume and N-day average volume.
-
Add Trend Strength Filters: Introduce trend strength indicators such as ADX (Average Directional Index), only allowing entries when the trend is strong enough (e.g., ADX > 25), helping to avoid false signals generated in weak trends or oscillating markets.
-
Perfect Long-Short Strategy Balance: Extend the strategy to support short trading, generating short signals when the 5-day EMA crosses below the 20-day EMA and the price is below the 30-day EMA, achieving trading capabilities under all market conditions.
-
Add Backtesting Optimization Framework: Introduce parameter optimization mechanisms to automatically test combinations of different EMA periods, stop-loss, and take-profit levels, finding optimal parameter settings under different market environments. For example, testing various combinations of short-period EMAs in the range of 3-8 days and medium-period EMAs in the range of 15-30 days.
-
Integrate Market Sentiment Indicators: Consider using market sentiment indicators such as VIX as additional filter conditions, adjusting or suspending trading during periods of extreme market sentiment to avoid taking excessive risks in abnormal market environments.
Summary
This quantitative trading strategy based on multi-period exponential moving averages and market time filtering forms a logically clear and precisely executable trading system through the golden cross of the 5-day EMA and 20-day EMA combined with price position judgment. The strategy is particularly suitable for medium to short-term trend trading, with advantages in comprehensive signal confirmation mechanisms and clear risk control frameworks, but also inherent limitations such as moving average lag and market condition dependency.
By introducing optimization measures such as dynamic stop-losses, volume confirmation, and trend strength filtering, the strategy has the potential to further enhance stability and adaptability. For quantitative traders, this strategy framework provides a good starting point that can be adjusted and expanded according to personal risk preferences and market environments to form a more personalized and efficient trading system. The concise design and clear logic of the strategy also make it an ideal educational tool for learning quantitative trading, helping traders understand the basic principles of trend following and risk management.
- 1