Moving Average RSI Crossover Momentum Confirmation Strategy

Overview
The Moving Average RSI Crossover Momentum Confirmation Strategy is a quantitative trading system that combines Simple Moving Averages (SMA) and Relative Strength Index (RSI). This strategy utilizes the synergy between two technical indicators to identify buy and sell signals, where SMA determines the overall trend direction, while RSI confirms overbought and oversold conditions. The strategy performs well in medium-term trending markets, particularly suitable for the 1-hour timeframe. The core principle is generating buy signals when the short-term SMA crosses above the long-term SMA (golden cross) and RSI is above the oversold level; sell signals are generated when the short-term SMA crosses below the long-term SMA (death cross) and RSI is below the overbought level. Additionally, the strategy incorporates flexible take profit management mechanisms, including full position and half position take profit options, providing traders with more refined position management tools.
Strategy Principles
The strategy's principles are based on the collaborative work of two core technical indicators:
-
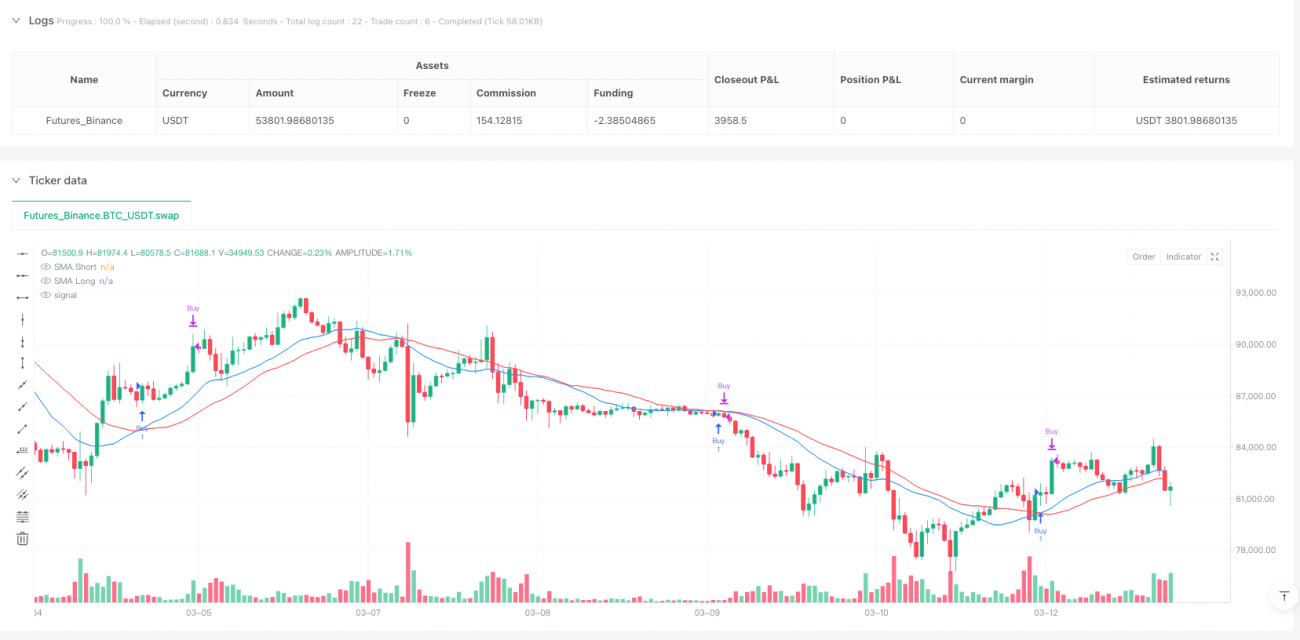
Simple Moving Averages (SMA): The strategy uses two SMAs with different periods, defaulting to a short-term 20-period and a long-term 30-period. When the short-term SMA crosses above the long-term SMA, it indicates that price momentum is shifting to an uptrend, forming a potential buy signal; conversely, when the short-term SMA crosses below the long-term SMA, it indicates that price momentum is shifting to a downtrend, forming a potential sell signal.
-
Relative Strength Index (RSI): The strategy uses a 14-period RSI to confirm whether the market is in overbought or oversold conditions. An RSI below 25 is considered oversold, while an RSI above 75 is considered overbought. The RSI indicator serves as a filter in this strategy, ensuring buy signals occur when RSI has already moved out of oversold territory, and sell signals occur when RSI has moved out of overbought territory.
The specific trading logic is as follows:
- Buy Signal: Triggered when the short-term SMA crosses above the long-term SMA (golden cross) and the RSI value is greater than the oversold level (25).
- Sell Signal: Triggered when the short-term SMA crosses below the long-term SMA (death cross) and the RSI value is less than the overbought level (75).
In the code implementation, ta.crossover and ta.crossunder functions are used to detect SMA crossovers, combined with RSI conditions to generate the final buy and sell signals. Trading states are tracked using boolean variables inBuyState and inSellState, ensuring the strategy correctly manages position status.
Strategy Advantages
After an in-depth analysis of the code, this strategy demonstrates several significant advantages:
-
Synergistic Effect of Indicator Combination: The strategy cleverly combines a trend-following indicator (SMA) with a momentum indicator (RSI), effectively reducing false signals. SMA crossovers confirm changes in trend direction, while RSI further validates the momentum state of the market, improving signal reliability when used together.
-
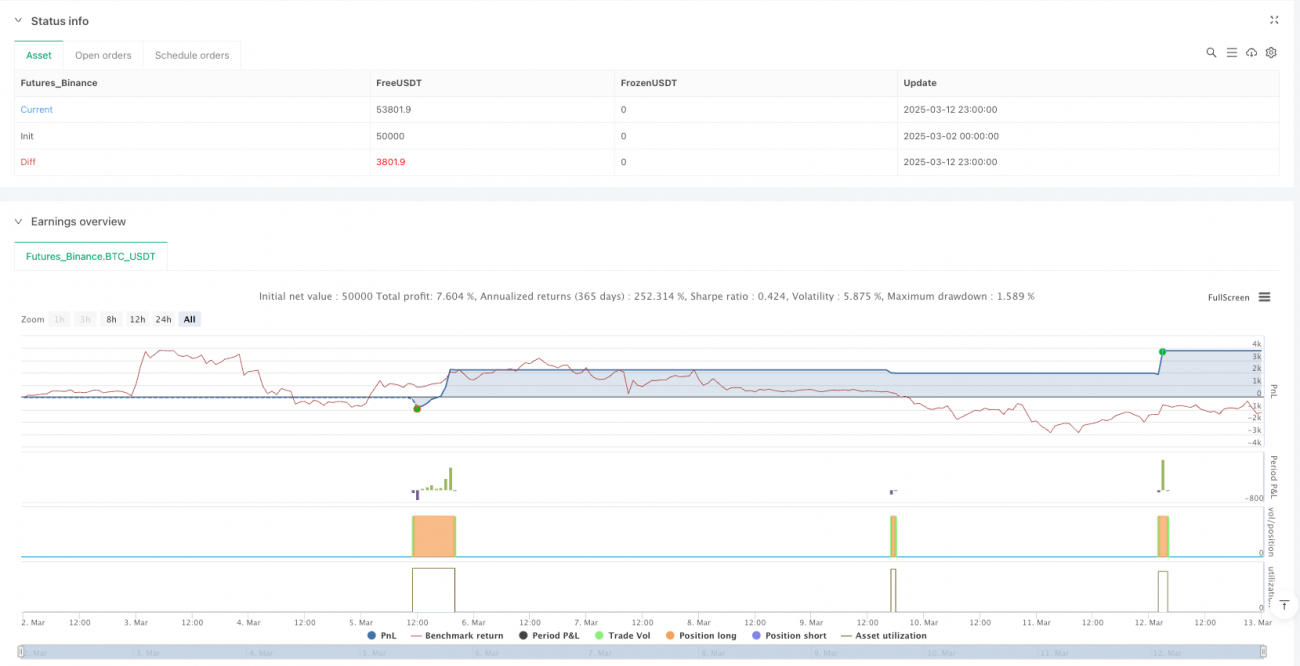
Flexible Take Profit Mechanism: The strategy features a customizable take profit function, defaulting to a 2% target profit rate. More importantly, traders can choose to enable or disable the take profit function, or even select a half-position take profit mode (halfPositionTakeProfit), closing only half of the position when reaching the target price and allowing the remaining position to continue capturing potential gains. This flexibility enables traders to adjust the strategy according to their risk preferences and market conditions.
-
Parameter Customizability: All key parameters of the strategy can be adjusted through input variables, including short and long-term SMA periods, RSI period, overbought/oversold thresholds, and take profit percentage. This makes the strategy adaptable to different market environments and trading instruments.
-
Intuitive Visualization Effects: The strategy plots short-term and long-term SMA lines on the chart and changes candlestick colors based on market state (green for buy state, red for sell state), allowing traders to visually track strategy signals and market conditions.
-
Clear Code Structure: The strategy code is well-organized, using variables to track market status, entry price, and half-position take profit status, with clear logic that is easy to understand and maintain.
Strategy Risks
Despite being well-designed, the strategy still has some potential risks:
-
False Signals in Ranging Markets: In sideways or range-bound markets, SMA crossovers may occur frequently, leading to overtrading and consecutive losses. In such market environments, SMA indicators often produce many invalid crossing signals.
-
Parameter Sensitivity: The strategy's performance is quite sensitive to SMA and RSI parameter settings. Different market environments may require different parameter configurations; if parameters are set inappropriately, the strategy may fail to capture the market's true turning points.
-
Limitations of a Single Signal System: The strategy relies solely on technical indicators to generate signals, without considering other important factors such as market structure, support/resistance levels, or fundamental factors. In certain market conditions, a purely technical indicator-driven strategy may disconnect from actual market movements.
-
Potential Issues with Take Profit Settings: Fixed percentage take profit settings may not be suitable for all market environments. In highly volatile markets, a 2% take profit may be too small, causing frequent profit-taking and missing larger trends; in low-volatility markets, the 2% target might be too aggressive.
Methods to reduce these risks include:
- Backtesting and optimizing parameters under different market conditions
- Adding additional filtering conditions, such as considering longer-term trend direction or market volatility
- Combining with other technical analysis methods or fundamental analysis to confirm signals
- Implementing dynamic take profit mechanisms that automatically adjust take profit levels based on market volatility
Strategy Optimization Directions
Based on code analysis, the strategy has several possible optimization directions:
-
Dynamic Parameter Adjustment Mechanism: Currently, the strategy uses fixed SMA and RSI parameters. An effective optimization direction would be to implement dynamic parameter adjustments, such as automatically adjusting SMA periods or RSI thresholds based on market volatility (ATR). Using shorter SMA periods in high-volatility markets and longer SMA periods in low-volatility markets could better adapt to different market environments.
-
Add Trend Strength Filtering: A trend strength indicator like ADX (Average Directional Index) could be added to filter SMA crossover signals. Only when ADX is above a certain threshold (like 25) would the trend be considered strong enough to execute trade signals generated by SMA crossovers. This helps avoid false signals in weak trend or ranging markets.
-
Add Dynamic Stop Loss Mechanism: The current strategy only has a take profit function without a stop loss mechanism. It's recommended to add an ATR-based dynamic stop loss to limit maximum losses on single trades. For example, setting the stop loss level at entry price minus 2 times the ATR value would automatically adjust stop loss distance based on market volatility.
-
Optimize Half-Position Take Profit Logic: The current half-position take profit logic could be further improved, such as moving the stop loss for the remaining position to the entry price (breakeven stop) after reaching the first take profit target, or setting multiple take profit targets for partial position closing. This would protect existing profits while maximizing opportunities to capture larger trends.
-
Add Trading Time Filter: Many markets exhibit different characteristics during different trading sessions. Consider adding a trading time filter to execute trading signals only during specific high-quality trading sessions (such as the overlap of European and American trading hours).
The core idea behind these optimization directions is to make the strategy more adaptable, automatically adjusting its behavior based on market conditions, thereby improving its stability and profitability across different market environments.
Summary
The Moving Average RSI Crossover Momentum Confirmation Strategy is a quantitative trading system combining the technical analysis indicators SMA and RSI, generating trading signals by identifying trend turning points and confirming momentum conditions. The strategy's main advantages lie in its simplicity, customizability, and built-in flexible take profit mechanism, making it an effective tool for medium-term trend following.
Despite risks such as false signals in ranging markets and parameter sensitivity, the strategy's robustness and adaptability can be significantly improved by introducing dynamic parameter adjustments, trend strength filtering, dynamic stop losses, and optimized position management. In particular, integrating the ATR indicator into parameter adjustment and risk management can help the strategy better adapt to different market volatility conditions.
This strategy is suitable for medium to long-term trending markets and serves as a simple yet expandable starting point for traders interested in quantitative trading. Through continuous optimization and personalization, traders can develop this basic strategy into a unique trading system suited to their trading style and risk preferences. Finally, it is recommended that traders thoroughly backtest the strategy and conduct simulated trading before live trading to verify its performance under different market conditions.
- 1