
Strategy Overview
This quantitative trading strategy skillfully combines the strengths of the Relative Strength Index (RSI) and Exponential Moving Averages (EMA), while incorporating multi-timeframe analysis as a filtering mechanism. The core design revolves around the collaborative confirmation between daily and weekly RSI indicators, capturing trend inflection points through EMA crossovers, aimed at identifying sustainable momentum trading opportunities. The strategy employs adaptive entry and exit logic, utilizing cross-validation from multiple technical indicators to effectively enhance the reliability of trading signals.
Strategy Principles
The strategy is designed based on the following core principles:
-
Multi-Timeframe RSI Filtering:
- Daily RSI serves as the primary signal generation source
- Weekly RSI acts as a trend confirmation filter, ensuring trade direction aligns with the larger cycle trend
- Buy conditions require Weekly RSI > 55 and Daily RSI > 55
- Sell conditions require Weekly RSI < 45 and Daily RSI < 45
-
EMA Crossover System:
- Uses 13-period and 21-period EMA crossovers as the main entry signals
- 34-period and 55-period EMAs provide support/resistance levels and exit references
- Fast EMA (13-period) crossing above slow EMA (21-period) triggers buy signals
- Fast EMA crossing below slow EMA triggers sell signals
-
Signal Confirmation Mechanism:
- Trades are executed only when EMA crossover signals align with RSI direction in both timeframes
- Multi-timeframe data integration is achieved through the request.security function
- Multiple condition filtering reduces false signals and frequent trading in oscillating markets
-
Precise Exit Strategy:
- Long position exit conditions: EMA1 crosses below EMA3 or price breaks below EMA4
- Short position exit conditions: EMA1 crosses above EMA3 or price breaks above EMA4
- Position closing logic is independent of entry conditions, with greater emphasis on risk control
Strategy Advantages
Through in-depth code analysis, the following significant advantages of this strategy can be summarized:
-
Multi-Level Signal Filtering System:
- Integration of short-term and long-term RSI reduces false breakout risks
- Combination of multiple EMAs forms dynamic support and resistance zones, improving signal quality
- Multiple confirmation mechanisms significantly reduce ineffective trades in "oscillating markets"
-
Highly Adaptive Trend Identification:
- Capable of early entry in the initial phase of trends, rather than entering after trends mature
- Higher-level filtering through weekly RSI avoids trades against the main trend direction
- EMA crossover system naturally filters market noise
-
Comprehensive Risk Management Mechanism:
- Clear exit condition design prevents emotional position holding
- Automatic position closing when reversal signals appear, effectively controlling drawdowns
- Design of closing positions before opening reverse positions enhances capital efficiency
-
High Customizability:
- All key parameters are adjustable through the input function
- Supports personalized adjustment of RSI thresholds and EMA lengths to adapt to different market environments
- Signal sensitivity can be customized according to different instrument characteristics
Strategy Risks
Despite its reasonable design, the strategy still has the following potential risks and limitations:
-
Parameter Sensitivity:
- The choice of RSI and EMA parameters significantly impacts strategy performance
- Overly sensitive parameters may lead to excessive trading
- Solution: Parameter optimization and backtesting based on historical data, avoiding overfitting
-
Poor Performance in Range-Bound Markets:
- May generate frequent false signals in sideways markets without clear trends
- EMA crossover strategies are naturally weak in oscillating markets
- Solution: Add volatility filters or trend strength indicators, automatically reducing position sizes in low trend-strength environments
-
Lag Issues:
- Both EMA and RSI are lagging indicators, which may not respond timely in volatile markets
- The signal confirmation process may miss optimal entry points
- Solution: Consider introducing leading indicators such as volume or price pattern recognition
-
Signal Scarcity:
- Multiple condition filtering may result in fewer trading signals
- Long periods without trading opportunities in low-volatility environments
- Solution: Consider adding auxiliary trading signals or moderately relaxing condition requirements
Strategy Optimization Directions
Based on code analysis, the following are possible optimization directions for this strategy:
-
Adaptive Parameter System:
- Implement dynamic adjustment of RSI thresholds and EMA periods, automatically optimizing based on market volatility
- Add ATR (Average True Range) indicator to adjust stop-loss positions according to market volatility
- Introduce market state classification, using different parameter settings in trending and oscillating markets
-
Enhanced Signal Quality:
- Integrate volume confirmation mechanisms, requiring increased volume when signals appear
- Add price action filtering for false breakouts, such as requiring closing prices to firmly establish above EMA
- Introduce trend strength indicators like ADX, executing full position trades only in strong trend environments
-
Improved Capital Management:
- Implement volatility-based dynamic position management, automatically reducing positions in high-volatility environments
- Introduce pyramid-style position building strategy, incrementally increasing positions after trend confirmation
- Design intelligent stop-loss and take-profit systems based on risk-reward ratios
-
Multi-Market Adaptability:
- Add instrument characteristic analysis, automatically adjusting strategy parameters for different categories
- Implement market correlation analysis to avoid excessive concentration of risk
- Add intraday and long-cycle signal collaboration mechanisms, forming a multi-level trading system
Conclusion
The Multi-Timeframe RSI & EMA Crossover Momentum Quantitative Strategy is an elegantly designed quantitative trading system that builds a three-dimensional signal generation and filtering mechanism by integrating RSI indicators from different time periods with multiple EMAs. The core advantage of this strategy lies in its multi-layered confirmation system, which can effectively capture trend inflection points while avoiding frequent trading in oscillating markets.
The strategy's risks primarily center on parameter sensitivity and performance in oscillating markets, but these risks can be effectively mitigated through the introduction of adaptive parameter systems and enhanced market state recognition mechanisms. Future optimization directions should focus on signal quality enhancement, dynamic parameter adjustment, and intelligent capital management to improve the strategy's robustness and stability across different market environments.
From an overall perspective, this strategy has clear logic and reasonable design, making it a quantitative trading system with practical value. Through fine-tuning and continuous optimization, it can evolve into a highly adaptive, risk-controlled long-term trading solution.
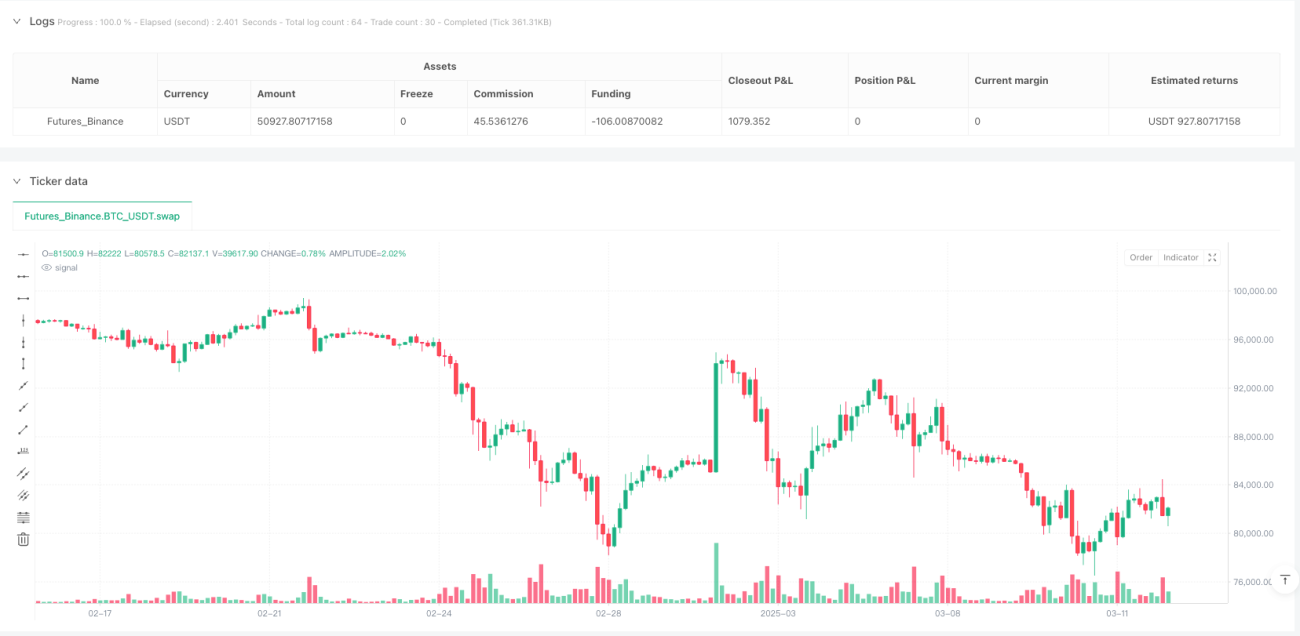
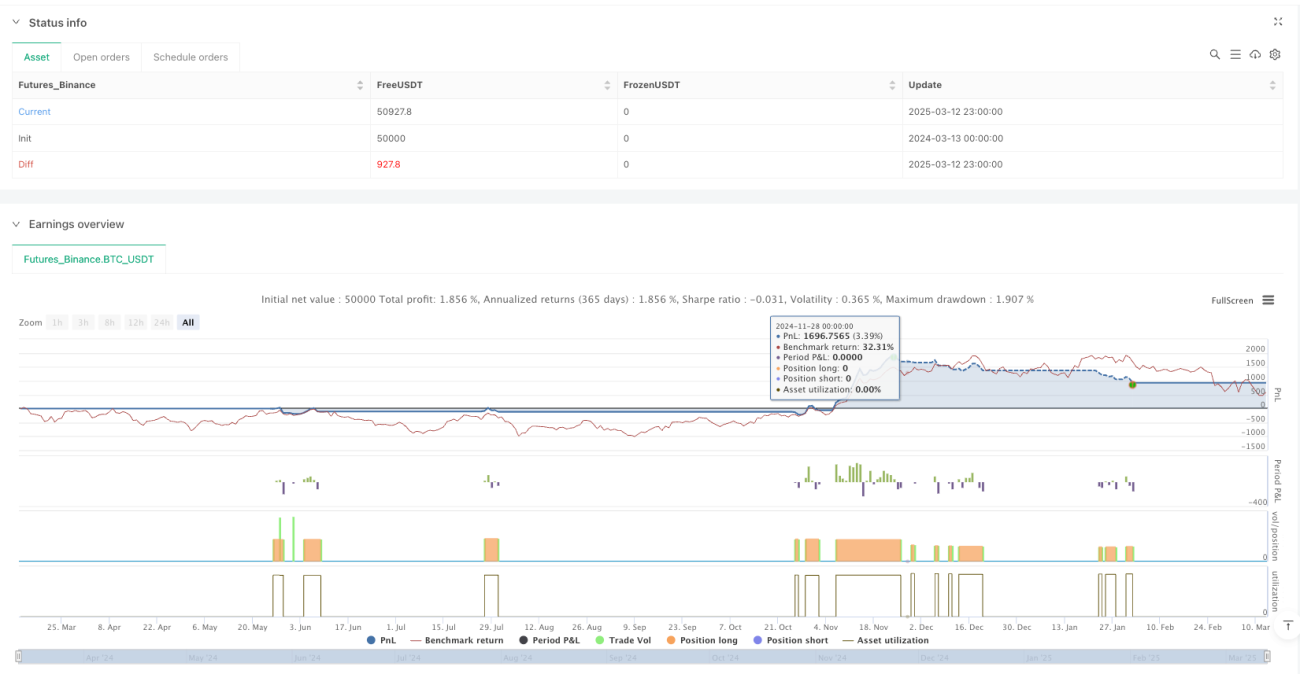
/*backtest
start: 2024-03-13 00:00:00
end: 2025-03-13 00:00:00
period: 3h
basePeriod: 3h
exchanges: [{"eid":"Futures_Binance","currency":"BTC_USDT"}]
*/

//@version=6
strategy("RSI & EMA Crossover Strategy with Daily & Weekly RSI Filter", overlay=true, default_qty_type=strategy.percent_of_equity, default_qty_value=10)

// === INPUTS ===- 1