
Overview
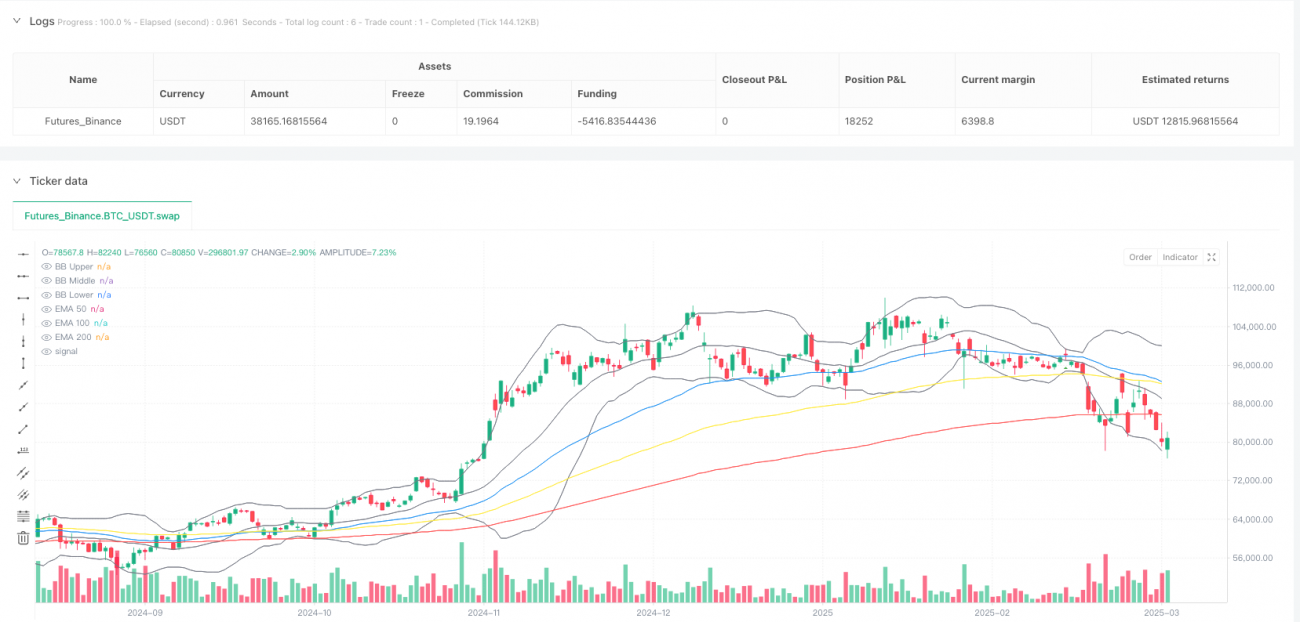
The "Multi-Indicator Trend Confirmation Trading System - EMA Confluence with RSI Divergence and MACD Signal Strategy" is a comprehensive quantitative trading system that identifies market trends and potential trading opportunities by combining multiple technical indicators. This strategy primarily relies on the coordinated confirmation of three Exponential Moving Averages (EMAs), Relative Strength Index (RSI), Moving Average Convergence Divergence (MACD), and Bollinger Bands to enhance the reliability and accuracy of trading signals.
The core philosophy of this strategy is to execute trades only when multiple indicators provide confirmation simultaneously, creating a "consensus mechanism" that effectively reduces the risk of false signals. In clearly trending market environments, the strategy confirms the overall direction through the hierarchical structure of EMAs, then combines momentum indicators like RSI and MACD to precisely time entries, forming a comprehensive and robust trading system.
Strategy Principles
The Multi-Indicator Trend Confirmation Trading System operates based on the following key principles:
-
EMA System Trend Confirmation: The strategy employs three different period (50, 100, 200) Exponential Moving Averages (EMAs) to form a hierarchical structure. An uptrend is confirmed when the short-term EMA (EMA50) is above the medium-term EMA (EMA100), which is above the long-term EMA (EMA200); conversely, a downtrend is confirmed.
-
Price and EMA Crossover Signals: The strategy identifies crossover points between price and EMA50 as potential entry signals. A long signal is generated when price crosses above EMA50 and other conditions are met; a short signal is generated when price crosses below EMA50 and other conditions are met.
-
RSI Filter Conditions: RSI indicator (period 14) is used to verify market momentum. Long signals require the RSI value to be greater than 50 but less than 70, avoiding entries in already overbought areas; short signals require the RSI value to be less than 50 but greater than 30, avoiding entries in already oversold areas.
-
MACD Direction Confirmation: The relative position of the MACD line to the signal line further confirms trend direction. Long signals require the MACD line to be above the signal line; short signals require the MACD line to be below the signal line.
-
Bollinger Bands Auxiliary Analysis: The system displays Bollinger Bands (20,2) to help traders intuitively understand market volatility. While Bollinger Bands don't directly participate in signal generation, they serve as an auxiliary judgment tool.
The trade execution logic is as follows:
- Long Condition: Price crosses above EMA50 AND EMA50 > EMA100 > EMA200 AND RSI > 50 AND RSI < 70 AND MACD line > Signal line
- Short Condition: Price crosses below EMA50 AND EMA50 < EMA100 < EMA200 AND RSI < 50 AND RSI > 30 AND MACD line < Signal line
Strategy Advantages
-
Multi-Layer Filtering Mechanism: By requiring multiple indicators to simultaneously meet specific conditions, the strategy effectively reduces false signals and improves the quality and reliability of trading signals. Signals are only generated when trend, momentum, and price action are all confirmed.
-
Trend Following and Momentum Combination: The strategy considers both trend factors (through the EMA system) and momentum factors (through RSI and MACD), providing a comprehensive market analysis that leads to more balanced trading decisions.
-
Avoiding Extreme Area Trading: By filtering with RSI upper and lower limits, the strategy avoids chasing highs or lows in overbought or oversold areas, effectively mitigating the high risk of counter-trend trading.
-
Adaptation to Different Market Cycles: By integrating indicators from different time periods (short-term, medium-term, long-term moving averages), the strategy can find suitable trading opportunities across various market cycles, demonstrating strong adaptability.
-
Visual Intuitiveness: The strategy displays signals clearly and intuitively, using triangle markers to precisely indicate entry points, while different colored moving averages and Bollinger Bands provide visual references for market structure, making it easy for traders to understand and execute.
-
Clear and Objective Rules: Trading rules are entirely based on objective technical indicators, eliminating subjective judgment factors, which helps traders maintain discipline and strictly follow the trading plan.
Strategy Risks
-
Lag Risk: As a moving average-based system, this strategy has some inherent lag, which may cause missed optimal entry or exit points, especially during rapid market reversals or increased volatility.
-
Poor Performance in Ranging Markets: In sideways or trendless market environments, the strategy may generate frequent false signals, leading to "whipsaw" losses. This risk is particularly significant when prices oscillate around moving averages.
-
Indicator Conflict Risk: While multi-indicator strategies improve signal reliability, they may also cause conflicts between indicators, making it difficult to generate clear signals in certain market environments and potentially missing trading opportunities.
-
Parameter Optimization Excess: The strategy uses multiple adjustable parameters (such as moving average periods, RSI thresholds), creating a risk of over-optimization (overfitting), which may perform excellently on historical data but poorly in live trading.
-
Lack of Stop-Loss Mechanism: The code does not explicitly set a stop-loss strategy, which may result in significant losses if trends suddenly reverse.
Risk Solutions:
- Implement appropriate stop-loss mechanisms, such as ATR-based dynamic stops or fixed percentage stops
- Implement money management rules to limit risk exposure per trade
- Add market environment filters to reduce trading frequency or pause trading in ranging markets
- Use adaptive parameters or switch parameter settings in different market environments
- Incorporate higher timeframe analysis to improve overall judgment accuracy
Strategy Optimization Directions
-
Add Market Environment Recognition Mechanism: Introduce ADX (Average Directional Index) to identify whether the market is in a clear trend, only allowing trades when ADX is above a specific threshold (e.g., 25), avoiding frequent trading in ranging markets.
-
Improve Money Management and Risk Control:
- Implement dynamic stop-loss strategies, such as ATR-based trailing stops
- Add profit protection mechanisms, moving stops to breakeven when profits reach certain levels
- Dynamically adjust position sizes based on market volatility
-
Enhance Entry Condition Precision:
- Consider adding volume confirmation mechanisms, requiring volume increase when signals appear
- Add price pattern recognition, such as breakout confirmation or pullback confirmation
- Incorporate higher timeframe trend direction confirmation
-
Introduce Adaptive Parameters:
- Allow moving average periods to automatically adjust based on market volatility, using shorter periods in low volatility environments and longer periods in high volatility environments
- Make RSI overbought/oversold thresholds dynamically adjust according to the overall market environment
-
Add Scaled Entry and Exit Mechanisms: Instead of all-in-one-go position building, implement a scaled entry strategy, entering positions in multiple stages after a signal appears, and similarly scaling out of positions when taking profits, improving capital efficiency and reducing timing risk.
The rationale for these optimization directions is that while the original strategy is relatively complete in its signal generation mechanism, it still has limitations in risk management and market adaptability in practical applications. By adding market environment filtering, improving risk control, and introducing adaptive parameters, the strategy can maintain its original advantages while significantly improving stability and robustness across different market environments.
Summary
The Multi-Indicator Trend Confirmation Trading System is a well-structured, logically clear quantitative trading strategy that builds a multi-level trade signal confirmation mechanism through the coordinated action of EMA systems, RSI, and MACD indicators. This strategy is particularly suitable for clearly trending market environments, effectively capturing medium to long-term trend changes and finding relatively ideal entry points.
The main advantage of the strategy lies in its multi-indicator collaborative confirmation mechanism, which greatly improves signal quality and avoids the potential misleading of single indicators, while reducing risk by avoiding trading in extreme areas. However, the strategy also faces challenges such as lag risk, poor adaptability in ranging markets, and insufficient risk control mechanisms.
Through optimizations such as adding market environment recognition, improving risk management, enhancing entry precision, introducing adaptive parameters, and implementing scaled trading, this strategy has the potential to develop into a more comprehensive, robust, and adaptive trading system. In practical application, traders should focus on testing performance in different market environments, setting parameters reasonably, and combining with sound money management rules to fully leverage the advantages of this strategy and achieve long-term stable trading results.
- 1