Quantum-Inspired Probability Trend Trading Strategy: EMA-RSI Based Quantitative Model
EMA RSI ATR Trend PROBABILITY QUANTUM WALK STOCHASTIC MODELING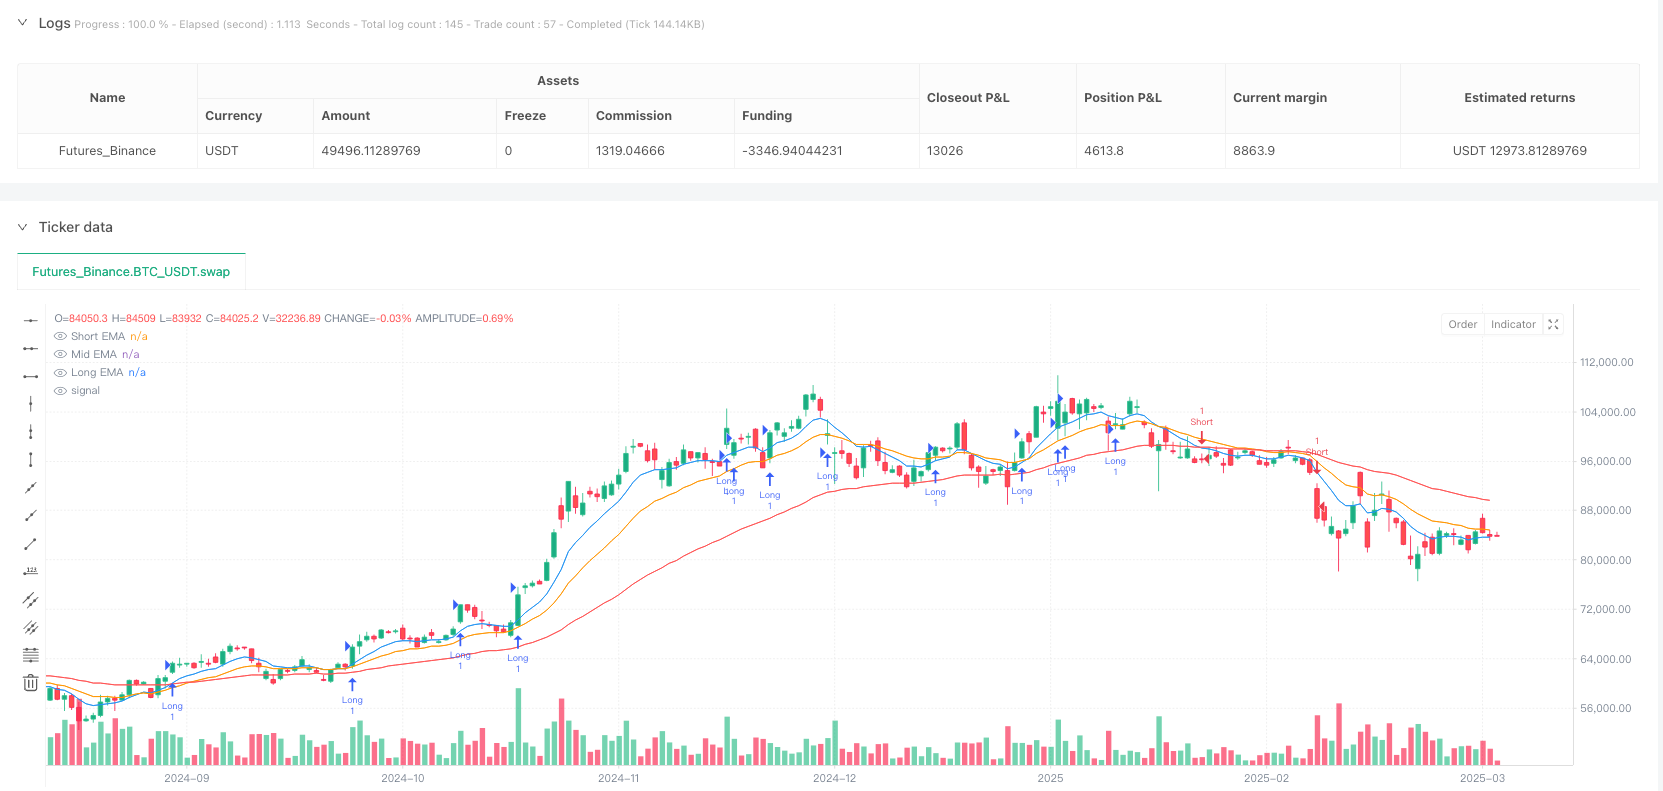
Overview
The Quantum-Inspired Probability Trend Trading Strategy is an innovative quantitative trading model that combines quantum random walk theory with traditional technical indicators. This strategy utilizes Exponential Moving Averages (EMA), Relative Strength Index (RSI), and Average True Range (ATR) to evaluate market trend direction and strength through quantum probability calculation methods, generating precise trading signals. The core of this strategy lies in applying probability distribution theories from quantum physics to financial market analysis, providing a novel approach to market prediction.
Strategy Principles
The operation of this strategy is based on several key components:
Multiple EMA Trend Identification System: The strategy employs three EMAs with different periods (9, 19, and 55) as baseline indicators for market trends. The relationship between short-term and long-term EMAs is mapped to a probability value between 0-1 through a quantum probability conversion function (Sigmoid function), representing the probability of the market being in an uptrend.
RSI Quantum Stochastic Walk Entry Probability: The strategy utilizes a 14-period RSI indicator, applying the same Sigmoid probability conversion to calculate the probability of price moving up or down. A long signal is generated when the RSI-converted probability exceeds 0.55 and the trend probability is greater than 0.6; a short signal is generated when the probability is less than 0.45 and the trend probability is below 0.4.
ATR-Based Quantum Decay Stop Loss & Take Profit: The strategy adopts a 14-period ATR as a volatility indicator, combining it with a time decay factor (based on periodic bar_index changes) to dynamically adjust stop-loss and take-profit levels. Through an exponential decay function, the stop-loss range gradually narrows as holding time increases, encouraging faster exits under unfavorable market conditions.
Probability Threshold Trading Triggers: Trades are executed only when probability values exceed specific thresholds, filtering out low-probability trading signals and improving the success rate of trades.
Strategy Advantages
Precision of Quantum Probability Model: Using Sigmoid functions to convert indicators into probability values better aligns with market uncertainty characteristics, providing more detailed market state assessments compared to traditional binary judgment methods.
Multi-level Trend Confirmation Mechanism: By combining short, medium, and long-term EMAs with RSI indicators, the strategy establishes a multi-dimensional trend confirmation system, reducing false breakout risks.
Dynamic Risk Management: The stop-loss and take-profit mechanism based on ATR and time decay factors automatically adjusts risk exposure according to real-time market volatility and holding time, optimizing capital management efficiency.
Strong Adaptability: Strategy parameters can be adjusted for different market environments, particularly the quantum walk factor (kFactor) parameter which controls the system’s sensitivity to market signals.
Quantified Decision Process: The strategy is fully quantified, eliminating emotional interference in trading decisions and ensuring consistency and discipline in trade execution.
Strategy Risks
Parameter Sensitivity: The quantum walk factor (kFactor) and probability thresholds significantly impact strategy performance; inappropriate parameters may lead to overtrading or missing important signals. Risk mitigation methods include comprehensive parameter optimization and backtesting to find optimal parameter combinations for specific markets.
Trend Reversal Risk: The strategy performs well in strong trending markets but may face challenges in ranging or rapidly reversing market environments. Testing across different market conditions and considering market environment filters is recommended.
Limitations of Time Decay Model: The current simple periodic time decay (bar_index % 50) may not capture all market cycle characteristics. Consider introducing more complex time series models or adaptive cycle recognition algorithms.
Overfitting Risk: The strategy employs multiple indicators and parameters, potentially overfitting historical data. Evaluate strategy robustness through out-of-sample testing and forward validation.
Computational Complexity: Probability calculations and exponential functions may increase computational burden, potentially causing execution delays in high-frequency trading environments. Optimize computational efficiency or reduce trading frequency to mitigate this issue.
Strategy Optimization Directions
Adaptive Quantum Walk Factor: The current strategy uses a fixed kFactor (0.1); consider designing it to automatically adjust based on market volatility. For example, increase kFactor in low-volatility markets to enhance sensitivity and decrease it in high-volatility markets to reduce noise interference.
Integrate Market State Classification: Introduce machine learning methods to classify market states (trending, oscillating, breakout, etc.) and apply specific parameter settings or sub-strategies for different market states.
Optimize Time Decay Model: Replace the simple periodic time decay with more sophisticated market cycle recognition algorithms such as wavelet analysis or Fourier transforms to more accurately capture market cyclical characteristics.
Introduce Quantum Entanglement Concepts: Consider correlations between different assets, applying quantum entanglement theory to multi-asset portfolio strategies for optimized asset allocation and risk diversification.
Enhance Probability Models: Extend the current Sigmoid probability model by introducing more complex probability distributions (such as Beta distribution or mixed Gaussian models) to more accurately model market uncertainty.
Summary
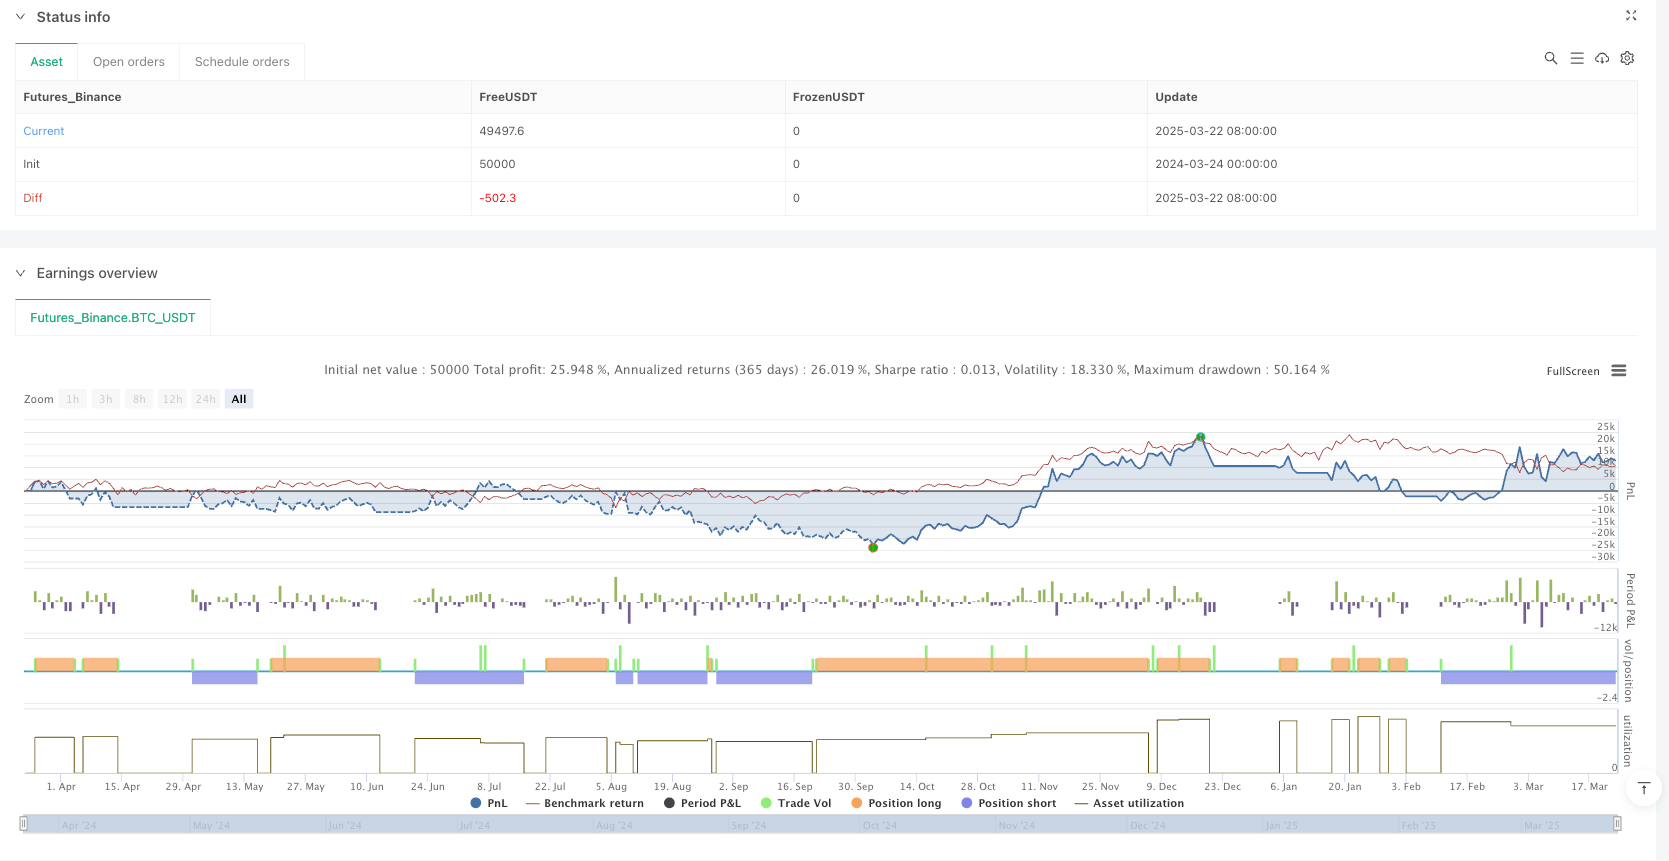
The Quantum-Inspired Probability Trend Trading Strategy innovatively combines quantum random walk theory with traditional technical analysis to create a novel framework for market probability prediction. The strategy’s strengths lie in its precise probability model, multi-level trend confirmation mechanism, and dynamic risk management system, enabling it to capture trading opportunities in trending markets while effectively controlling risk.
Despite challenges including parameter sensitivity, trend reversal risk, and potential overfitting issues, the strategy has the potential to become a more robust and adaptive trading system through improvements in quantum walk factors, market state classification integration, time decay model refinement, and probability distribution model expansion. Applying quantum computing concepts to trading strategies represents a frontier development in quantitative trading, offering new perspectives and methodologies for traditional technical analysis.
/*backtest
start: 2024-03-24 00:00:00
end: 2025-03-23 00:00:00
period: 1d
basePeriod: 1d
exchanges: [{"eid":"Futures_Binance","currency":"BTC_USDT"}]
*/

//@version=6
strategy("Quantum-Inspired Trading Strategy", overlay=true)

// Parameters
emaShortLength = input.int(9, "Short EMA")
emaMidLength = input.int(19, "Mid EMA")
emaLongLength = input.int(55, "Long EMA")
atrLength = input.int(14, "ATR Length")
kFactor = input.float(0.1, "Quantum Walk Factor")

// Moving Averages & Trend Probability
emaShort = ta.ema(close, emaShortLength)
emaMid = ta.ema(close, emaMidLength)
emaLong = ta.ema(close, emaLongLength)

trendProb = 1 / (1 + math.exp(-kFactor * (emaShort - emaLong)))
trendBullish = trendProb > 0.6
trendBearish = trendProb < 0.4

// RSI-Based Quantum Stochastic Walk Entry Probability
rsi = ta.rsi(close, 14)
probabilityDirection = 1 / (1 + math.exp(-kFactor * (rsi - 50)))
longCondition = probabilityDirection > 0.55 and trendBullish
shortCondition = probabilityDirection < 0.45 and trendBearish

// ATR-Based Quantum Decay Stop Loss & Take Profit
atr = ta.atr(atrLength)
timeDecay = bar_index % 50 // Use bar_index directly

decayFactor = math.exp(-0.02 * timeDecay)
stopLoss = atr / decayFactor
takeProfit = atr * 1.5 / decayFactor

// Trade Execution
if longCondition
    strategy.entry("Long", strategy.long)
    strategy.exit("Exit Long", from_entry="Long", stop=close - stopLoss, limit=close + takeProfit)

if shortCondition
    strategy.entry("Short", strategy.short)
    strategy.exit("Exit Short", from_entry="Short", stop=close + stopLoss, limit=close - takeProfit)

// Plotting indicators
plot(emaShort, color=color.blue, title="Short EMA")
plot(emaMid, color=color.orange, title="Mid EMA")
plot(emaLong, color=color.red, title="Long EMA")