Overview
The Dynamic Position Sizing and Entry Candle Stop-Loss EMA Crossover Strategy is a quantitative trading approach that combines exponential moving average (EMA) crossover signals with dynamic position sizing and precise stop-loss placement. The core concept involves identifying when the 10-period EMA crosses above the 20-period EMA (golden cross) while ensuring the current candle is bullish (close higher than open). What makes this strategy unique is its dynamic position calculation method based on current price volatility and its use of the entry candle’s low as a stop-loss level to achieve better risk control. The strategy also enhances trade signal visualization by displaying tiny triangle markers on the chart to identify entry points.
Strategy Principles
This strategy operates based on several core principles:
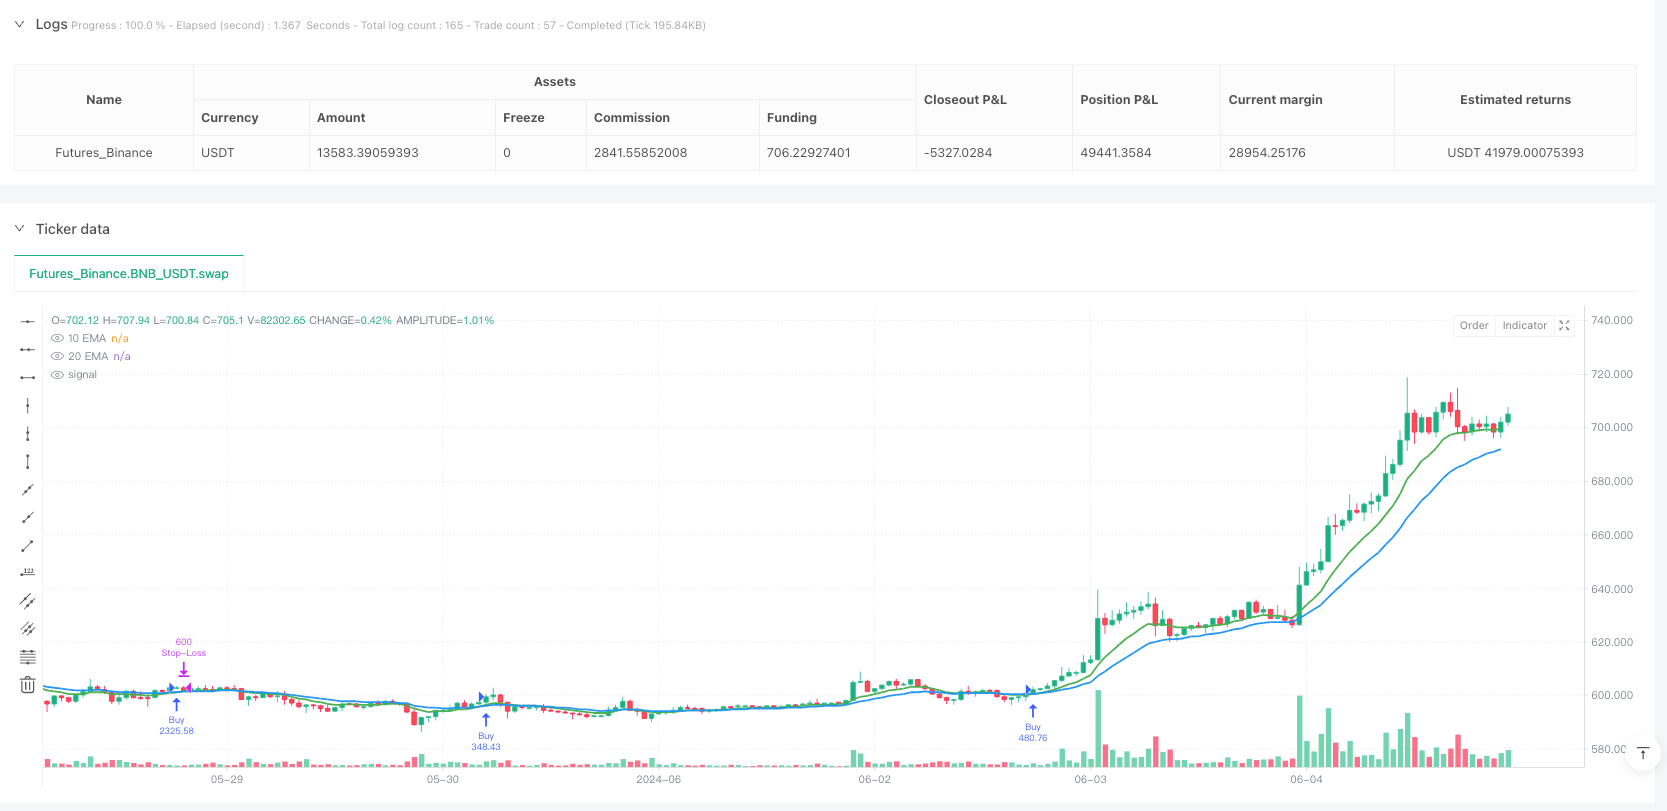
EMA Crossover Signal: The strategy employs 10-period and 20-period exponential moving averages. When the shorter-term (10-period) EMA crosses above the longer-term (20-period) EMA, it generates a potential long entry signal. This crossover is commonly referred to as a “golden cross” and is typically viewed as the beginning of an uptrend.
Bullish Candle Confirmation: To increase signal reliability, the strategy requires that the close must be above the open (forming a bullish candle) on the same bar where the EMA crossover occurs. This condition ensures that the market demonstrates some buying pressure when the signal appears.
Dynamic Position Sizing: The strategy employs an innovative dynamic position calculation method using the formula
1000 / (close - low)to determine the purchase quantity. This method increases position size when candle volatility is low and decreases it when volatility is high, automatically adjusting for volatility.Entry Candle Stop-Loss: The strategy sets the stop-loss at the low of the entry candle, providing a natural stop-loss location based on actual market volatility, rather than using a fixed percentage or point-based stop.
Visual Signals: When the long condition is triggered, the strategy adds a tiny green triangle marker below the candle, helping traders visually identify entry signals.
Strategy Advantages
Analyzing the code implementation of this strategy, we can summarize the following significant advantages:
Dual Conditions for Trend Confirmation: By combining the EMA crossover with bullish candle confirmation, the strategy reduces the likelihood of false signals, only trading when there is sufficient market support.
Intelligent Dynamic Position Sizing: The dynamic position allocation calculated based on candle high-low differential can automatically adapt to changes in market volatility. It increases position size in environments with low volatility (potentially lower risk) and decreases position size in environments with high volatility (potentially higher risk), achieving intelligent risk adjustment.
Adaptive Stop-Loss Strategy: Using the entry candle’s low as a stop-loss provides a method based on natural market support levels, avoiding the problems of fixed stops being triggered too early or being too distant to effectively protect capital.
Visually Clear Trading Signals: Through tiny triangle markers, traders can intuitively identify trading signals, improving the convenience of strategy use and the efficiency of trading decisions.
Clear and Concise Code Structure: The implementation code is simple and straightforward, easy to understand and modify, making it convenient for traders to make personalized adjustments according to their needs.
Strategy Risks
Despite its many advantages, this strategy also has some potential risks and limitations:
False Breakout Risk: In oscillating markets, EMA crossover signals may produce numerous false breakouts, leading to frequent stop-loss exits and capital losses. The solution is to add additional filtering conditions, such as longer-term trend confirmation or volatility indicator filtering.
Extreme Cases in Dynamic Position Calculation: When the intra-candle volatility is very small (close price near the low), the calculated position size may become abnormally large, leading to excessive leverage risk. It is recommended to set a maximum position limit to avoid taking on too much risk in extreme cases.
Too-Close Stop-Loss Risk: If the entry candle’s low is very close to the entry price, the stop-loss may be too tight and easily triggered by normal market noise. Consider adding a buffer zone to the stop-loss or adjusting the stop-loss distance using volatility indicators like ATR.
Lack of Profit Targets: The strategy defines clear entry and stop-loss conditions but does not set profit targets or other exit conditions, which may result in failure to lock in profits when trends reverse. Consider adding exit conditions based on trailing stops or reverse EMA crossovers.
Inflexible Fixed Parameters: The EMA periods (10 and 20) are fixed and may not be suitable for all market environments and time periods. It is recommended to perform backtesting optimization on these parameters or consider using adaptive parameter methods.
Strategy Optimization Directions
Based on in-depth analysis of the strategy, here are several possible optimization directions:
Add Trend Filters: Introduce longer-period trend indicators (such as 50-period EMA or 200-period EMA) and only execute trades when the major trend direction is consistent, which can reduce false breakouts. This optimization can significantly improve strategy performance in strong trend markets.
Incorporate Volatility Adjustment: Integrate the ATR (Average True Range) indicator to adjust stop-loss distances and dynamic position calculations, allowing the strategy to better adapt to different volatility environments. In high-volatility periods, set looser stops and smaller positions; in low-volatility periods, do the opposite.
Add Profit Targets and Trailing Stops: Implement dynamic profit targets based on market volatility and use trailing stops to protect profits as trends develop. For example, set profit targets based on ATR multiples, or use trailing stops to gradually raise the stop-loss level as prices rise.
Add Volume Confirmation: Add volume confirmation to the EMA crossover signal, only executing trades when supported by volume, which can improve signal reliability. High-volume breakouts are typically more reliable than low-volume ones.
Optimize Dynamic Position Sizing Formula: Modify the position calculation formula, adding upper and lower constraints, and consider incorporating it into an overall risk management framework to ensure that the risk of a single trade does not exceed a certain percentage (e.g., 1-2%) of the total account value.
Parameter Adaptive Mechanism: Implement an adaptive mechanism for EMA periods, automatically adjusting them according to market conditions, allowing the strategy to better adapt to different market environments. For example, use longer EMA periods in high-volatility markets and shorter EMA periods in low-volatility markets.
Summary
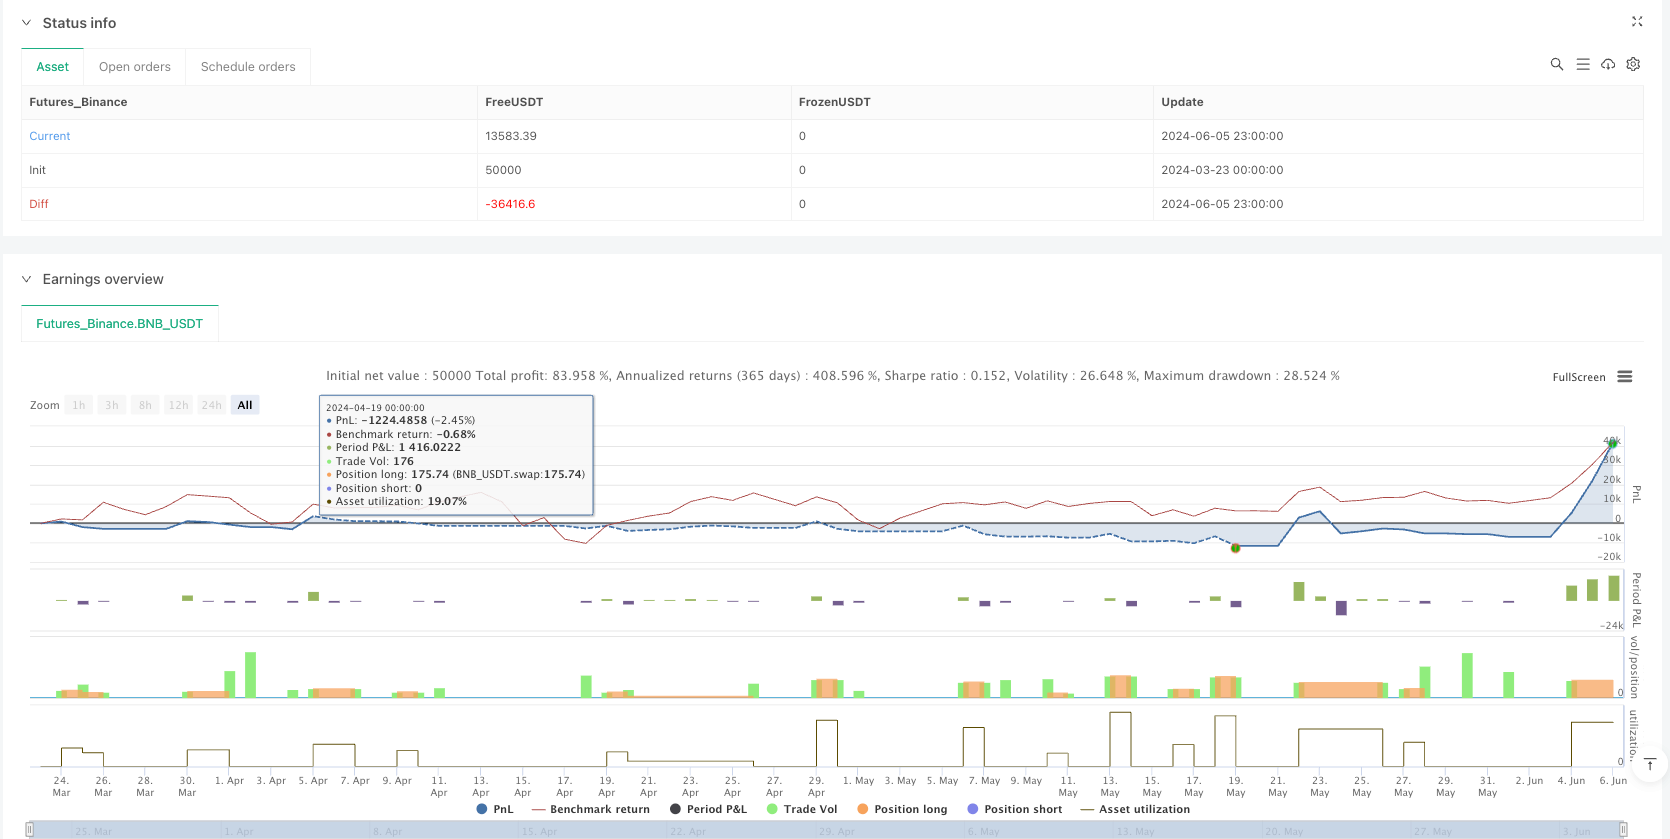
The Dynamic Position Sizing and Entry Candle Stop-Loss EMA Crossover Strategy is a quantitative trading method that combines trend following, dynamic position management, and precise stop-loss placement. Through the dual conditions of EMA crossover and bullish candle confirmation, the strategy can identify potential uptrends; through dynamic position calculations based on candle volatility, it achieves intelligent adjustment to market risk; through setting the entry candle’s low as the stop-loss, it provides a risk control method based on natural market support levels.
While this strategy may perform well in trending markets, it may face false breakout risks in sideways, oscillating markets. By improving in areas such as adding trend filters, volatility adjustments, profit target setting, volume confirmation, and optimizing position calculation, the strategy’s robustness and profitability can be further enhanced.
Most importantly, any trading strategy needs thorough historical backtesting and simulation trading before actual application to verify its performance in different market environments. At the same time, good risk management is always the foundation of successful trading. Even the best strategies need the support of strict capital management and risk control measures.
/*backtest
start: 2024-03-23 00:00:00
end: 2024-06-06 00:00:00
period: 1h
basePeriod: 1h
exchanges: [{"eid":"Futures_Binance","currency":"BNB_USDT"}]
*/

// This Pine Script™ code is subject to the terms of the Mozilla Public License 2.0 at https://mozilla.org/MPL/2.0/
// © nadeemred19

//@version=6
strategy("EMA Crossover with Tiny Triangle Signal & Dynamic Quantity", overlay=true)

// EMA Indicators
ema10 = ta.ema(close, 10)
ema20 = ta.ema(close, 20)

// Plot EMAs
plot(ema10, title="10 EMA", color=color.green, linewidth=2)
plot(ema20, title="20 EMA", color=color.blue, linewidth=2)

// Bullish candle condition
bullishCandle = close > open

// Variables to store entry candle low
var float entryCandleLow = na

// Entry Signal: 10 EMA crosses over 20 EMA AND candle is bullish
longCondition = ta.crossover(ema10, ema20) and bullishCandle

// Calculate dynamic stock quantity: 1000 / (close - low)
var float buyQty = na
if (longCondition)
    entryCandleLow := low
    buyQty := 1000 / (close - low)

// Plot Tiny Triangle Entry Signal
if (longCondition)
    label.new(bar_index, low, "▲", color=color.green, textcolor=color.green, size=size.tiny, style=label.style_label_down, yloc=yloc.belowbar)

// Entry and stop-loss
if (longCondition)
    strategy.entry("Buy", strategy.long, qty=buyQty)
    strategy.exit("Stop-Loss", from_entry="Buy", stop=entryCandleLow)