Dynamic Resistance and Support Dual Candlestick Pattern ATR Risk Management Quantitative Trading Strategy

Overview
The "Dynamic Resistance and Support Dual Candlestick Pattern ATR Risk Management Quantitative Trading Strategy" is a trading system that combines multiple classic indicators from technical analysis. This strategy is primarily based on the dynamic identification of support and resistance levels, integrated with the powerful reversal signal of Engulfing Patterns, and employs the ATR (Average True Range) indicator for risk management. The strategy fuses three dimensions in its trading decisions: price structure, candlestick pattern recognition, and volatility analysis, using multiple confirmations to increase the reliability of trading signals. The strategy design employs a dynamic method for calculating support and resistance levels, which can flexibly adapt to different market environments through the lookback period parameter, while using a fixed risk-reward ratio of 1:2 to set stop-loss and take-profit targets, embodying a strict risk management philosophy.
Strategy Principles
The core principles of this strategy are based on three key technical elements: support and resistance level determination, candlestick pattern recognition, and ATR risk management.
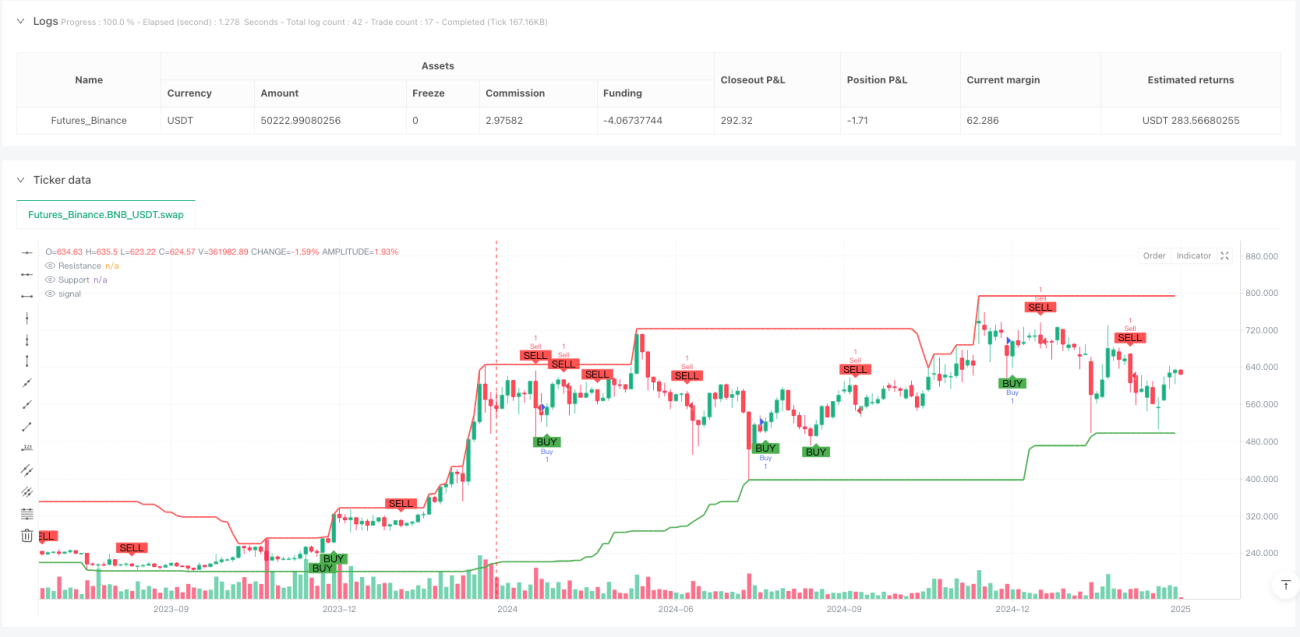
First, the strategy determines dynamic resistance and support levels by calculating the highest and lowest prices within a specified lookback period (default 50 periods). These price levels have historically had a significant impact on market movements and may do so again. The resistance level is determined by the highest price within the lookback period, representing areas of concentrated selling pressure; the support level is determined by the lowest price within the lookback period, representing areas of concentrated buying pressure.
Second, the strategy identifies two powerful reversal patterns—Bullish Engulfing and Bearish Engulfing. A Bullish Engulfing pattern appears during a downtrend, consisting of a small bearish candle followed by a larger bullish candle, where the body of the second bullish candle completely covers ("engulfs") the body of the previous bearish candle, indicating that buying pressure has overcome selling pressure and potentially signaling an upward trend reversal. A Bearish Engulfing pattern is the opposite, appearing during an uptrend, consisting of a small bullish candle followed by a larger bearish candle, similarly indicating a shift in power and potentially signaling a downward trend reversal.
Third, entry signals must simultaneously meet both pattern confirmation and price position conditions:
- Buy signal: Must have both a Bullish Engulfing pattern and the current closing price above the support level
- Sell signal: Must have both a Bearish Engulfing pattern and the current closing price below the resistance level
Finally, the strategy uses the ATR indicator for risk management. ATR measures market volatility and is used to set stop-loss positions that adapt to current market conditions. The stop-loss distance is set at 1.5 times the ATR value, and the profit target is set at twice the stop-loss distance, forming a 1:2 risk-reward ratio, which conforms to the positive expectancy trading principle.
Strategy Advantages
-
Multi-dimensional signal confirmation mechanism: The strategy combines support/resistance levels and pattern recognition, requiring multiple conditions to be met simultaneously to generate trading signals, effectively reducing erroneous trades. Signals are only generated when the price is at a technically favorable position (above support or below resistance) and clear reversal patterns appear, increasing signal reliability.
-
Dynamic adaptation to market structure: Support and resistance levels are based on dynamic calculations rather than fixed values, allowing them to automatically adjust as the market evolves, keeping the strategy effective across different market cycles and volatility environments.
-
Volatility-based risk management: Using ATR for stop-loss settings ensures risk control adapts to current market volatility, avoiding stop-losses that are too tight (triggered by normal fluctuations) or too loose (excessive losses).
-
Strict risk-reward settings: Employing a 1:2 risk-reward ratio means that even with a win rate of only 40%, the strategy can still achieve profitability from a mathematical expectancy perspective, enhancing long-term stability.
-
Visually intuitive trading signals: The strategy clearly marks buy and sell signals and support/resistance levels on the chart, allowing traders to intuitively understand market structure and trading logic, facilitating real-time decision-making and subsequent analysis.
-
Flexible adjustable parameters: Key parameters (lookback period, ATR period, risk multiplier) can all be adjusted according to different market characteristics and personal risk preferences, enhancing strategy adaptability.
Strategy Risks
-
Delayed support and resistance level identification: Using historical highs/lows to calculate support and resistance levels has inherent lag, which may lead to delayed signals in rapidly breaking markets, missing optimal entry points or generating unnecessary trades. Improvement methods could include introducing trend strength filters or combining with other technical indicators.
-
Limitations of pattern recognition: Relying solely on dual candlestick patterns may be overly simplistic, as markets contain many false breakouts and deceptive signals. It is advisable to add volume confirmation or other technical indicators as auxiliary filtering conditions.
-
Pitfalls of fixed risk-reward ratios: Although a 2:1 risk-reward ratio is theoretically viable, not all market environments are suitable for this fixed ratio. In strong trending markets, it may take profits too early; in range-bound markets, profit targets may be difficult to reach. Consider dynamically adjusting the risk-reward ratio based on market conditions.
-
Parameter sensitivity: Strategy performance may be highly sensitive to key parameters (especially lookback period length). Too short a lookback period may cause support and resistance levels to change frequently, while too long may reduce the relevance of identified support and resistance levels to the current market. Comprehensive backtesting is recommended to optimize parameter settings for different market conditions.
-
Lack of market environment adaptability: The strategy does not differentiate between trending and consolidating market environments, potentially generating too many false signals in certain market states. Consider introducing trend identification mechanisms to apply different trading logic in different market environments.
-
Lack of money management mechanism: The code does not include position sizing logic, which may lead to incomplete risk control. Consider integrating a money management module to dynamically adjust trading size based on account size and current volatility.
Optimization Directions
-
Introduce trend filters: The current strategy is suitable for medium-term reversal trading but may frequently trigger counter-trend signals in strong trending markets. Consider adding trend identification components (such as moving average systems or ADX indicators) to trade only in the trend direction or use different parameter settings for different trend strengths.
-
Enhance pattern recognition: Pattern recognition capabilities could be expanded to include other high-probability reversal patterns such as hammer lines, star formations, etc., or introduce pattern confirmation mechanisms, such as requiring subsequent candles to continue confirming the reversal direction.
-
Dynamic risk management: Consider dynamically adjusting the risk-reward ratio based on market volatility and trend strength, using more relaxed profit targets in strong trending markets and more conservative settings in oscillating markets.
-
Add volume confirmation: Pattern signals combined with volume changes are usually more reliable. Volume conditions could be added, such as requiring significantly increased volume when patterns appear, to confirm price momentum.
-
Multi-timeframe analysis: Introduce multi-timeframe confirmation mechanisms to ensure the trading direction aligns with higher timeframe trends, avoiding counter-trend trading within larger trends.
-
Incorporate historical pattern performance statistics: Code could be added to track the historical performance of patterns under different market conditions, establishing a dynamic probability model to adjust signal credibility based on current market characteristics.
-
Add money management module: Implement dynamic position management based on account size, volatility, and consecutive losses, controlling single trade risk to not exceed a fixed percentage (e.g., 1-2%) of total capital.
Conclusion
The "Dynamic Resistance and Support Dual Candlestick Pattern ATR Risk Management Quantitative Trading Strategy" demonstrates a trading system design approach with clear structure and rigorous logic. By combining price structure analysis (support and resistance levels), pattern recognition (engulfing patterns), and scientific risk management (ATR-based stop-loss settings), this strategy creates a multi-dimensional confirmation trading system. The strategy's main advantages lie in its signal confirmation mechanism and volatility-adaptive risk control, though it also has limitations in areas such as delayed support/resistance identification and market environment adaptability.
Through the introduction of trend filtering, enhanced pattern recognition, dynamic risk management, and multi-timeframe analysis, this strategy has the potential to further improve its performance and adaptability. Particularly, adding money management modules and market state recognition mechanisms would elevate this strategy from a technical analysis tool to a complete trading system. This strategy is especially suitable for medium-term traders looking for reversal opportunities, and with reasonable expectancy management, it has the potential to achieve long-term stable trading performance.
Ultimately, the success of any trading strategy depends not only on the technical design of the strategy itself but also on the trader's deep understanding of the market and confidence in the strategy logic. Only by fully understanding the strategy principles, accepting its limitations, and maintaining trading discipline can the optimal performance of the strategy be achieved.
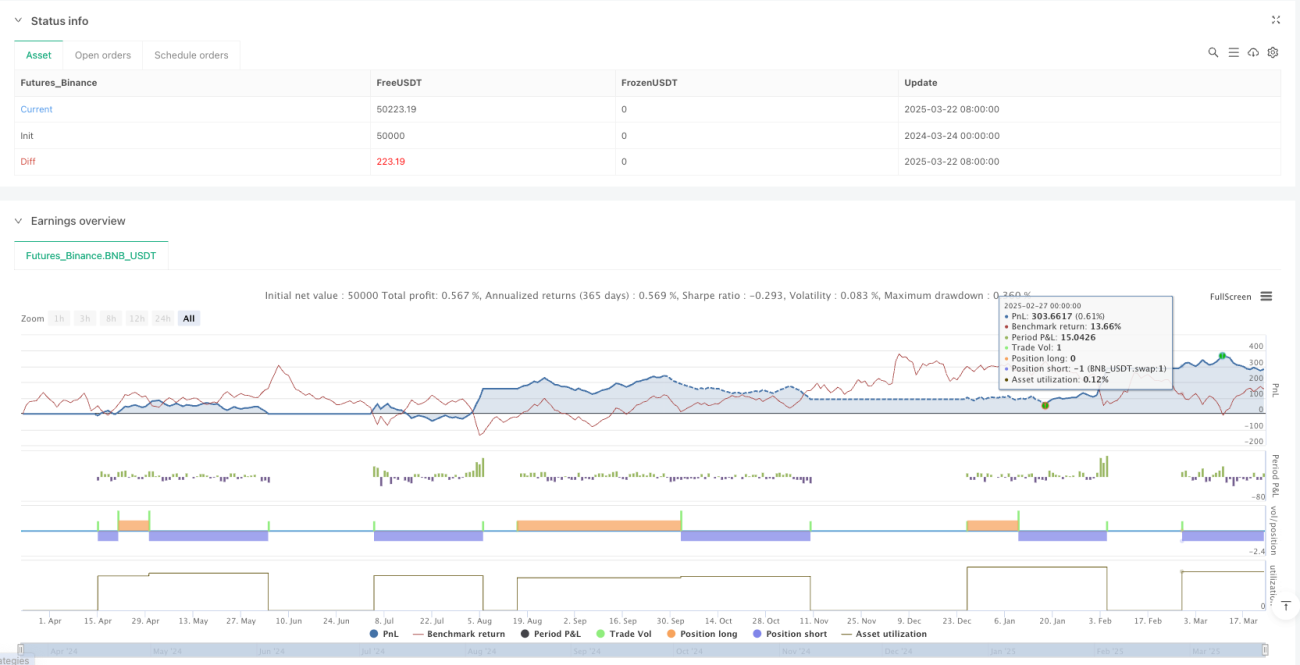
/*backtest
start: 2024-03-24 00:00:00
end: 2025-03-23 00:00:00
period: 3d
basePeriod: 3d
exchanges: [{"eid":"Futures_Binance","currency":"BNB_USDT"}]
*/

// This Pine Script™ code is subject to the terms of the Mozilla Public License 2.0 at https://mozilla.org/MPL/2.0/
// © watcharaphon0619

//@version=5- 1