Long-term Trend and Volatility Recognition Combined Exponential Moving Average SuperTrend Quantitative Trading Strategy

Overview
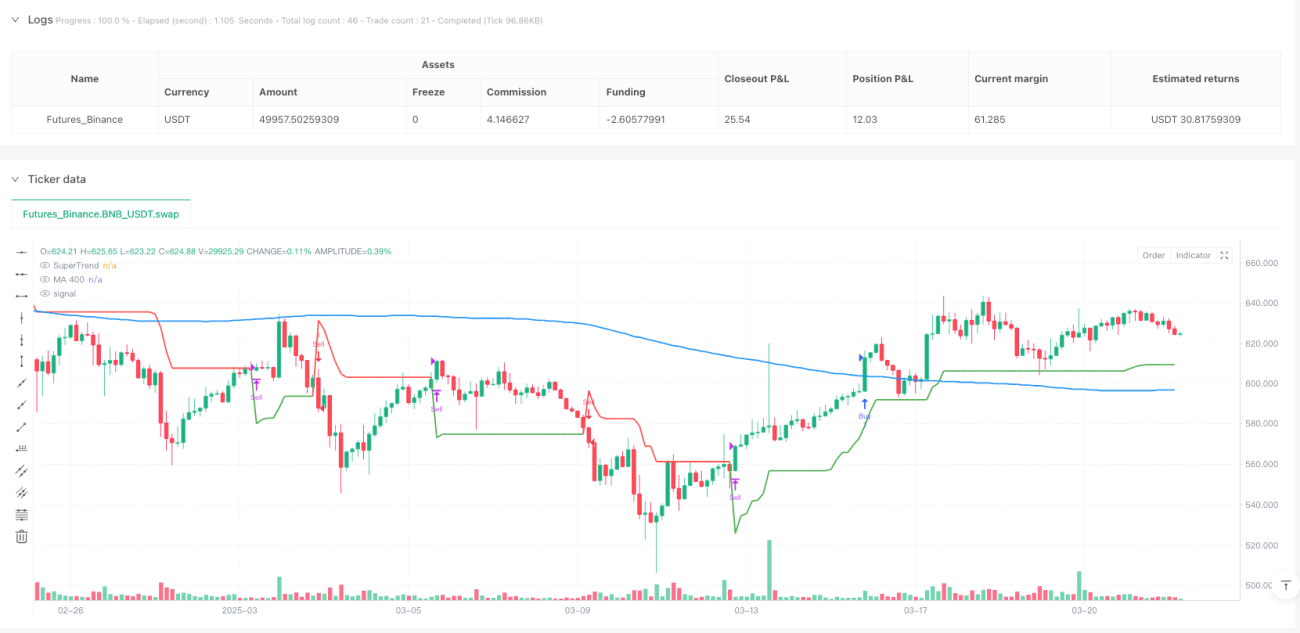
The Exponential Moving Average SuperTrend Quantitative Trading Strategy introduced in this article is a trading system that combines long-term trend analysis with volatility recognition. The strategy primarily uses EMA 200 (200-period Exponential Moving Average) to determine the long-term trend direction of the market, and combines the SuperTrend indicator to provide precise entry and exit signals. The strategy operates on the H2 (2-hour) timeframe, generating trading signals by identifying the relationship between price and moving averages, as well as color changes in the SuperTrend indicator. The core of this strategy is to trade only when both the long-term trend and short-term volatility confirmation signals align, thereby increasing the success rate of trades.
Strategy Principles
From analyzing the code, the core principles of this strategy are built on the synergistic effect of two main technical indicators:
-
Moving Average (MA 200): The code uses SMA (Simple Moving Average) set to 200 periods. This indicator is used to determine the long-term market trend. When the price is above MA 200, it indicates the market is in a long-term uptrend; when the price is below MA 200, it indicates the market is in a long-term downtrend. This functionality is implemented in the code with
ma_400 = ta.sma(close, ma_length). -
SuperTrend Indicator: This is a trend-following indicator based on ATR (Average True Range). In the code, SuperTrend calculation involves several steps:
- Calculating ATR:
atr = ta.atr(period) - Setting upper and lower bands:
up = hl - factor * atranddn = hl + factor * atr - Determining trend based on price relationship with bands:
trend := close > trendDown[1] ? 1 : close < trendUp[1] ? -1 : nz(trend[1], 1) - Final SuperTrend line value:
superTrend = trend == 1 ? trendUp : trendDown
- Calculating ATR:
The trading logic of the strategy is as follows:
- Buy Signal: When the price is above MA 200 (long-term uptrend) and the SuperTrend indicator is green (value 1, short-term uptrend), the system generates a buy signal. This is implemented in the code with
longCondition = close > ma_400 and trend == 1. - Sell Signal: When the price is below MA 200 (long-term downtrend) and the SuperTrend indicator is red (value -1, short-term downtrend), the system generates a sell signal. This is implemented in the code with
shortCondition = close < ma_400 and trend == -1. - Position Closing Logic: When the SuperTrend trend changes (from 1 to -1 or from -1 to 1), the system closes the corresponding position. This is implemented in the code with
if (strategy.position_size > 0 and trend == -1)andif (strategy.position_size < 0 and trend == 1).
Strategy Advantages
Through in-depth analysis of the strategy's code, the following significant advantages can be summarized:
-
Dual Verification of Trend Confirmation: The strategy uses two indicators, MA 200 and SuperTrend, for cross-validation. Signals are only generated when both indicators confirm the trend direction, greatly reducing the possibility of false signals.
-
Strong Adaptability: The SuperTrend indicator is calculated based on ATR, which automatically adjusts according to market volatility, making the strategy maintain stable performance in different volatility environments. This adaptive feature is implemented in the code with
atr = ta.atr(period). -
Clear Entry and Exit Rules: The strategy provides clear entry conditions and exit rules, reducing the impact of subjective judgment and helping maintain trading discipline. Entry conditions are defined by
longConditionandshortCondition, and exit rules are triggered by SuperTrend trend changes. -
Built-in Risk Control Mechanism: The strategy automatically closes positions when the trend reverses, effectively controlling the loss extent of a single trade. The
strategy.closefunction in the code ensures timely exit from the market when the trend reverses. -
Visual Intuitiveness: The strategy plots MA 200 and SuperTrend lines on the chart, with color coding (green for uptrend, red for downtrend) allowing traders to intuitively identify market conditions. This is implemented through the
plotfunction.
Strategy Risks
Despite the many advantages of this strategy, the following potential risks can also be identified from the code analysis:
-
Lag during Trend Reversals: Moving averages are lagging indicators and may produce delayed signals at trend turning points, leading to untimely entries or exits. Especially the 200-period moving average reacts slowly and may cause significant losses in fast markets.
-
No Fixed Stop Loss Setting: There is no explicit stop-loss strategy in the code, relying only on trend reversal signals to close positions, which may lead to significant losses during market gaps or rapid changes. It is recommended to add fixed stop-loss levels, such as using the
strategy.exitfunction to set stop-losses. -
Parameter Sensitivity: The performance of SuperTrend largely depends on its parameter settings (ATR period and multiplier). The current code uses fixed parameters (ATR period 14, multiplier 3.0), which may not be suitable for all market conditions.
-
Risk of Overtrading: In consolidating markets, MA 200 and SuperTrend may frequently issue contradictory signals, leading to multiple ineffective trades and additional trading costs.
-
Single Timeframe Limitation: The strategy analyzes only on the H2 timeframe, lacking multi-timeframe confirmation, which may miss important turning points in the context of larger trends.
Strategy Optimization Directions
Based on code analysis, here are several potential optimization directions for this strategy:
-
Dynamic Parameter Adjustment: Automatically adjust SuperTrend parameters based on market volatility. For example, increase the ATR multiplier in high-volatility markets and decrease it in low-volatility markets. This can be implemented by adding volatility condition judgments:
volatility_condition = ta.atr(14) / close * 100 dynamic_factor = volatility_condition > 2 ? 4.0 : 3.0 -
Add Fixed Stop Loss and Profit Targets: Set clear stop-loss and take-profit levels for each trade, rather than relying solely on trend reversals. This can be implemented by adding the
strategy.exitcommand:strategy.exit("Exit Long", "Buy", stop=entry_price * 0.98, limit=entry_price * 1.04) -
Add Filtering Conditions: Introduce other indicators such as RSI or MACD as filters to reduce false signals. For example, only accept signals when RSI is not at extreme levels:
rsi_value = ta.rsi(close, 14) valid_signal = rsi_value > 30 and rsi_value < 70 longCondition := longCondition and valid_signal -
Multi-Timeframe Analysis: Combine trend analysis from higher timeframes (such as daily or weekly) to ensure the trading direction aligns with the larger trend. This requires using the
securityfunction to introduce higher timeframe data. -
Volume Confirmation: Add volume analysis to ensure signals are generated with significant volume support, increasing signal reliability. This can be done by checking if the volume is above the average level:
            volume_confirmation = volume > ta.sma(volume, 20)
longCondition := longCondition and volume_confirmation
Summary
The Exponential Moving Average SuperTrend Quantitative Trading Strategy is a complete trading system that combines long-term trend analysis with short-term volatility recognition. By using MA 200 to determine the long-term trend direction and combining the SuperTrend indicator to provide precise entry and exit signals, this strategy aims to capture significant trending market conditions.
The core advantage of the strategy lies in its dual confirmation mechanism, effectively reducing false signals, while the ATR-based SuperTrend indicator provides adaptability to market volatility. However, the strategy also has some potential risks, such as lag, lack of fixed stop-loss, parameter sensitivity, etc.
By introducing dynamic parameter adjustment, fixed stop-loss/take-profit levels, additional filtering conditions, multi-timeframe analysis, and volume confirmation, the stability and profitability of the strategy can be further improved. Overall, this is a trend-following strategy with solid foundations and clear logic, suitable for application in moderately volatile market environments.
Code analysis shows that the strategy logic itself is universal and can be applied to various trading markets and instruments. As a quantitative trading system, it provides a good starting point, and traders can further customize and optimize it based on their risk preferences and market environment.
- 1