
Overview
The Multi-Indicator Dynamic Trading Strategy with Volume Confirmation System is a comprehensive technical analysis approach that cleverly combines four mainstream technical indicators: Exponential Moving Average (EMA), Moving Average Convergence Divergence (MACD), Relative Strength Index (RSI), and Bollinger Bands, while introducing a volume filtering mechanism as an additional confirmation condition. This strategy analyzes market dynamics from multiple dimensions, looking for price trends, momentum changes, overbought/oversold conditions, and volatility breakouts as trading signals, requiring these signals to appear with the support of higher volume to improve the accuracy and robustness of trading decisions.
Strategy Principles
The core principle of this strategy is to utilize a combination of multiple technical indicators to provide a more comprehensive market perspective, and to filter low-quality signals through volume confirmation. Specifically:
-
EMA Crossover System: The strategy uses a fast EMA (9-period) and a slow EMA (21-period). A bullish signal forms when the fast line crosses above the slow line; a bearish signal forms when the fast line crosses below the slow line. This component mainly captures changes in medium to short-term trends.
-
MACD Signals: Using standard MACD settings (short-term 12, long-term 26, signal line 9), a bullish signal is generated when the MACD line crosses above the signal line; crossing below generates a bearish signal. As a momentum indicator, MACD helps confirm trend strength and potential reversal points.
-
RSI Overbought/Oversold: Using a 14-period RSI with an overbought level of 70 and oversold level of 30. When RSI falls below 30, it's considered a buying opportunity; above 70 is seen as a selling signal. RSI helps identify potential market extremes and rebound opportunities.
-
Bollinger Band Breakouts: Using 20-period moving average and 2 standard deviation Bollinger Bands. Price breaking below the lower band is viewed as a buy signal; breaking above the upper band is viewed as a sell signal. Bollinger Bands help measure market volatility and identify when prices deviate from their normal range.
-
Volume Filter: Requires current volume to exceed 1.5 times the 20-period volume moving average. This ensures trades are only executed when market activity is higher, helping to avoid false signals in low liquidity environments.
Buy conditions are triggered when any of the four indicators above generates a buy signal and the volume condition is met; sell conditions are similar, executing when any of the four indicators generates a sell signal and the volume condition is met.
Strategy Advantages
-
Multi-dimensional Signal Confirmation: By integrating different types of technical indicators, the strategy can analyze the market from multiple angles, reducing the potential misleading of a single indicator. When multiple indicators simultaneously emit the same signal, the credibility of the trade significantly increases.
-
Flexible Entry Conditions: The strategy only needs one of the technical indicators to trigger a signal to enter, this "OR" logic allows the system to capture more potential opportunities without missing any important market turning points.
-
Volume Verification: Using volume as an additional filtering condition is a major highlight of this strategy, ensuring that trading signals are generated with sufficient market participation, greatly reducing the risk of false breakouts.
-
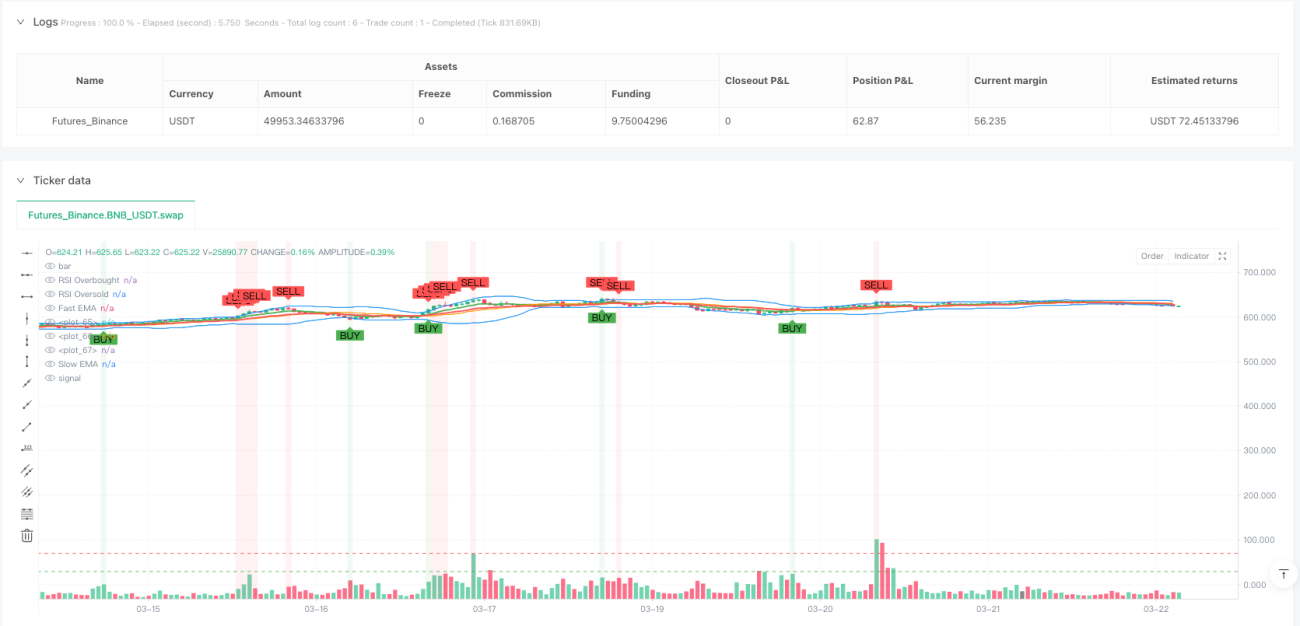
Visual Intuitiveness: The strategy clearly marks buy and sell signals on charts and provides additional visual confirmation through background color changes, allowing traders to easily identify trading opportunities.
-
Parameter Adjustability: All indicator parameters can be customized according to different market conditions and personal preferences, offering high flexibility and adaptability.
Strategy Risks
-
Signal Overload: As the strategy employs an "OR" logic, where any of the four indicators can trigger a trade, this may lead to overtrading and unnecessary commission costs.
-
Indicator Conflicts: Different indicators may simultaneously produce opposite signals, for example, RSI might show oversold while the EMA trend is still downward, requiring additional judgment from traders in such situations.
-
Volume Threshold Sensitivity: The 1.5x volume multiplier may be too high or too low in certain market environments, requiring adjustment based on specific trading instruments and market characteristics.
-
Parameter Optimization Trap: Excessive optimization of indicator parameters may result in a strategy that performs well on historical data but fails in future markets (overfitting risk).
-
Lack of Stop-Loss Mechanism: The current strategy code does not include explicit stop-loss settings, which could lead to significant losses during dramatic market volatility.
Strategy Optimization Directions
-
Signal Weighting System: Different indicators could be assigned weights, requiring the total weight to exceed a certain threshold to trigger a trade. For example, trend indicators (EMA, MACD) could be given higher weights, executing trades only when multiple indicators confirm simultaneously.
-
Timeframe Coordination: Introduce multi-timeframe analysis, requiring higher timeframe trends to align with current timeframe signals, increasing the probability of successful trades.
-
Dynamic Stop-Loss Settings: Automatically adjust stop-loss levels based on market volatility, for example, using the ATR (Average True Range) indicator to set stop distances, allowing prices more room to move in highly volatile markets.
-
Optimize Volume Filter: Consider using relative volume indicators (such as OBV or Chaikin Money Flow) to more precisely evaluate volume quality, rather than relying solely on simple volume multiples.
-
Add Trend Filter: Introduce longer-term trend indicators (such as 200-day moving average) as directional filters, executing trades only in the direction of the overall trend, avoiding counter-trend operations.
Summary
The Multi-Indicator Dynamic Trading Strategy with Volume Confirmation System is a comprehensive and flexible trading framework that provides traders with a multi-dimensional market analysis perspective by integrating various technical analysis tools combined with a volume verification mechanism. The power of this strategy lies in its ability to capture signals under different market conditions and the mechanism to increase trading reliability through volume confirmation.
While the strategy has some risks and limitations, through reasonable parameter adjustments and implementation of the above optimization suggestions, its performance in actual trading can be significantly improved. It is particularly worth noting that adding appropriate money management and stop-loss mechanisms will further enhance the robustness of the strategy.
For investors looking to build systematic trading methods based on technical analysis, this strategy provides a good starting point that can be further customized and refined according to personal risk preferences and market characteristics.
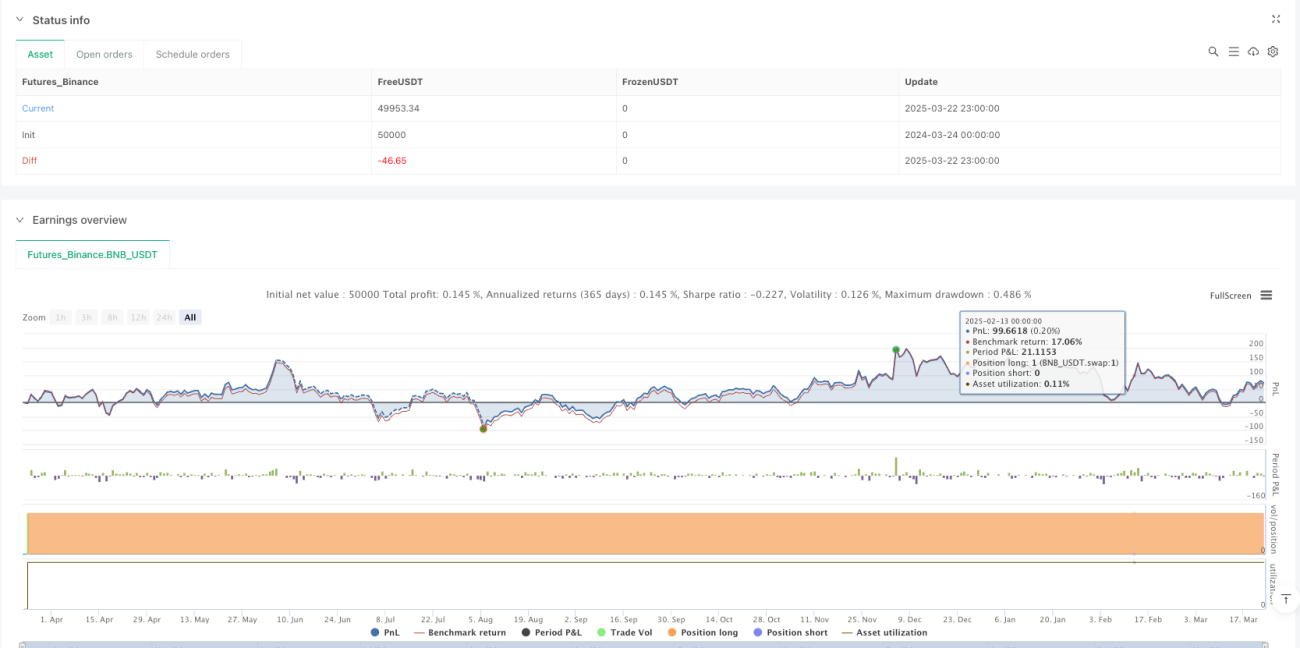
/*backtest
start: 2024-03-24 00:00:00
end: 2025-03-23 00:00:00
period: 1h
basePeriod: 1h
exchanges: [{"eid":"Futures_Binance","currency":"BNB_USDT"}]
*/

// This Pine Script™ code is subject to the terms of the Mozilla Public License 2.0 at https://mozilla.org/MPL/2.0/
// © yunusrrkmz
//@version=6
strategy("Advanced Trading Strategy", overlay=true)- 1