Advanced Momentum Trend EMA Crossover Strategy with RSI Confirmation System

Overview
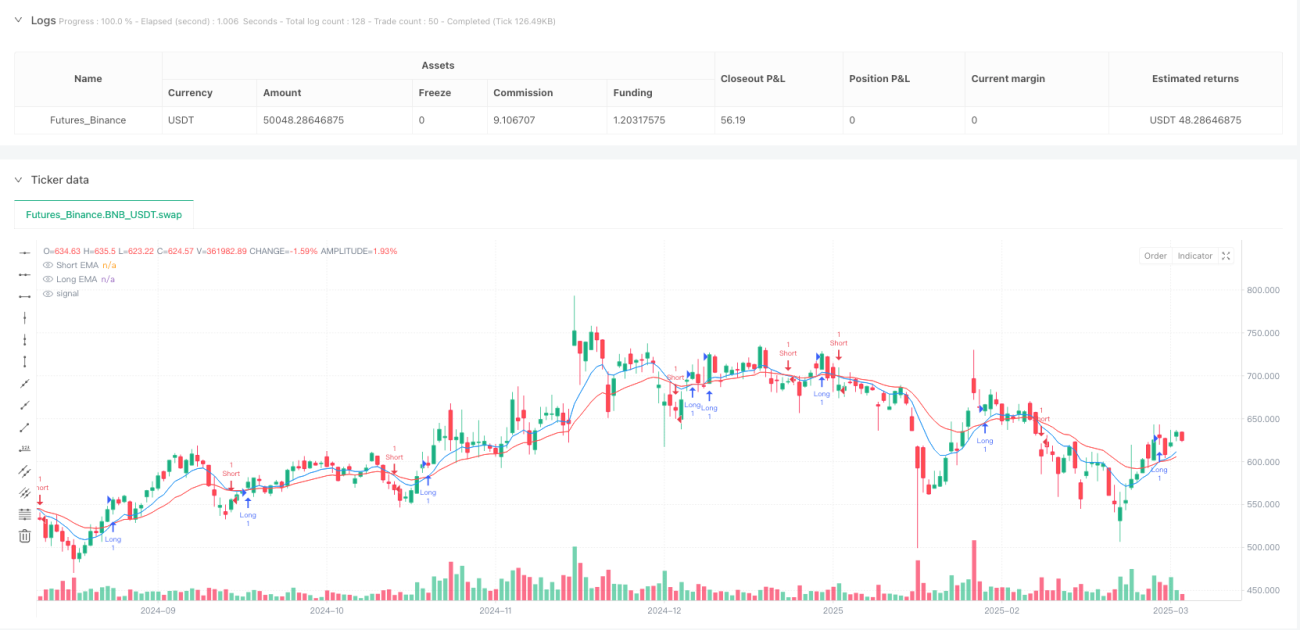
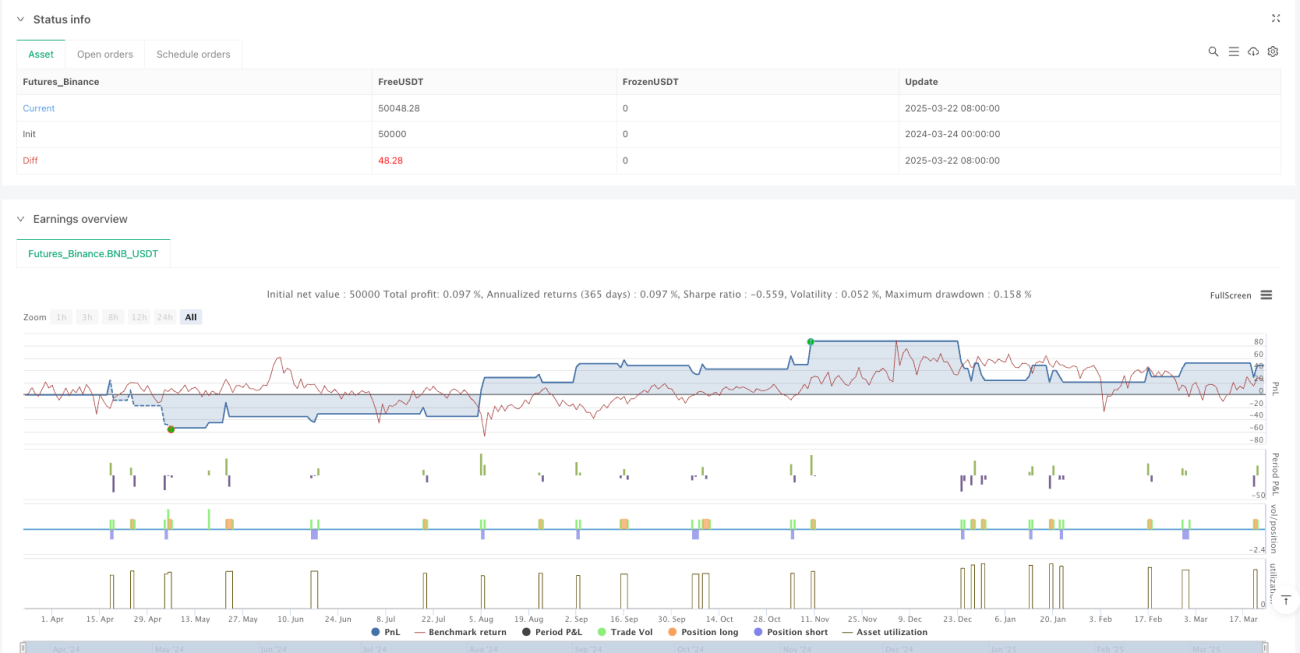
The Advanced Momentum Trend EMA Crossover Strategy with RSI Confirmation System is a quantitative trading strategy that combines Exponential Moving Average (EMA) crossover signals with Relative Strength Index (RSI) confirmation. The core concept of this strategy is to identify trend reversal points through crossovers between short-term and long-term EMAs, while using the RSI indicator as an additional filter to reduce false signals and improve trade quality. The strategy also integrates risk management features, including stop-loss and take-profit settings, as well as position closing mechanisms when reverse signals appear, forming a complete trading system.
Strategy Principles
The core logic of this strategy is based on several key technical elements:
-
EMA Crossover Signals: The strategy uses a 9-period short-term EMA and a 21-period long-term EMA. When the short-term EMA crosses above the long-term EMA, a buy signal is generated; when the short-term EMA crosses below the long-term EMA, a sell signal is generated.
-
RSI Confirmation Mechanism: To reduce false signals that may arise from EMA crossovers, the strategy incorporates a 14-period RSI indicator as a confirmation condition. Long entries are only executed when the RSI value is greater than 50 (indicating upward momentum), and short entries are only executed when the RSI value is less than 50 (indicating downward momentum).
-
Risk Management System: The strategy implements percentage-based stop-loss (default 1%) and take-profit (default 2%) mechanisms to control risk for each trade.
-
Signal Reversal Exit: In addition to stop-loss and take-profit, the strategy implements an exit mechanism based on signal reversal. When an opposite EMA crossover occurs, the current position is automatically closed to prevent larger losses from trend reversals.
The execution flow of the strategy is clear: first calculate the technical indicator values (EMA and RSI), then generate trading signals based on crossover conditions combined with RSI confirmation, and finally set risk management exit conditions, forming a complete trading loop.
Strategy Advantages
-
Dual Confirmation Mechanism: Combining EMA crossovers with RSI momentum confirmation significantly reduces false signals that might come from a single indicator, improving trade quality and win rate.
-
Integration of Trend and Momentum: The strategy effectively combines trend following (EMA crossovers) and momentum analysis (RSI), two different types of technical analysis methods, making signals more comprehensive and reliable.
-
Complete Risk Management: Through preset stop-loss and take-profit percentages, the risk-reward ratio for each trade is clearly defined, contributing to long-term stable capital management.
-
Flexible Parameter Settings: The strategy allows users to customize key parameters (EMA periods, RSI period, stop-loss and take-profit ratios), which can be adjusted according to different market environments and personal risk preferences.
-
Bidirectional Trading Capability: The strategy supports both long and short positions, enabling opportunity capture in various market conditions, not limited to unidirectional markets.
-
Automatic Position Protection: The signal reversal exit mechanism provides an additional layer of protection, allowing timely exits at the early stages of trend reversals, avoiding deep drawdowns.
Strategy Risks
-
Frequent Trading in Ranging Markets: In sideways, choppy markets, EMAs may cross frequently, potentially generating numerous false signals and trading costs even with RSI filtering. A solution is to add oscillation indicators like ATR (Average True Range) to filter out small-scale fluctuations.
-
Limitations of Fixed Percentage Stop-Loss: Preset percentage-based stop-losses may not be suitable for all market conditions, especially in environments with suddenly increased volatility. An optimization would be to introduce ATR-based dynamic stop-losses to better adapt to market volatility characteristics.
-
Sensitivity to Fast Gap Risks: In situations where prices gap significantly due to major news or events, preset stop-losses may experience severe slippage. It's recommended to add maximum position size limits to diversify single-trade risk.
-
Parameter Optimization Overfitting Risk: Excessive optimization of EMA and RSI parameters may lead to good backtest performance but poor live trading results. It's advisable to use rolling window testing and out-of-sample data validation to verify parameter robustness.
-
Delay in RSI Momentum Confirmation: RSI as a momentum indicator may have some lag, resulting in slightly delayed entries near trend reversal points. Consider introducing more sensitive momentum indicators such as Stochastic RSI as a supplement.
Strategy Optimization Directions
-
Add Timeframe Confirmation: Introduce multi-timeframe analysis, checking the trend direction of higher timeframes and only entering trades in the direction of the larger trend, which can significantly improve the strategy's win rate. This can be implemented by adding EMA direction judgment from longer periods (such as daily vs. hourly).
-
Dynamic Risk Management: Upgrade fixed percentage stop-losses to ATR-based dynamic stop-losses to better adapt to market volatility changes. Specifically, stop-losses can be set at N times ATR distance from the current price, rather than a fixed percentage.
-
Add Volume Confirmation: Combine EMA crossover signals with volume increase as additional confirmation to filter out weak breakouts with insufficient volume. It's recommended to monitor volume changes relative to previous average levels near crossover points.
-
Intelligent Trend Strength Filtering: Introduce trend strength indicators such as ADX (Average Directional Index), only executing trades when trends are clear (e.g., ADX > 25) to avoid frequent trading in ranging markets.
-
Optimize RSI Thresholds: The current strategy uses a fixed value of 50 as the RSI threshold. Consider dynamically adjusting based on market characteristics, such as using a 40-60 range in bull markets and a 30-70 range in bear markets to improve adaptability.
-
Add Machine Learning Elements: Use simple machine learning algorithms like logistic regression to predict signal reliability based on historical EMA crossover and RSI combination patterns, assigning confidence scores to each signal.
Conclusion
The Advanced Momentum Trend EMA Crossover Strategy with RSI Confirmation System is a structurally complete and logically clear quantitative trading system that balances trend following and momentum analysis technical methods with multi-layered risk management mechanisms to form a balanced trading strategy. The core advantages of this strategy lie in its dual confirmation mechanism for signal generation and comprehensive risk control, giving it adaptability across various market environments. However, the strategy still faces challenges in parameter sensitivity and market environment adaptability. Traders are recommended to optimize the strategy by incorporating market structure analysis, dynamic risk management, and multi-timeframe confirmation to improve long-term stability and profitability. Through continuous parameter testing and strategy upgrades, this system can become an effective tool in a trading portfolio.
/*backtest
start: 2024-03-24 00:00:00
end: 2025-03-23 00:00:00
period: 1d
basePeriod: 1d
exchanges: [{"eid":"Futures_Binance","currency":"BNB_USDT"}]
*/

//@version=5
strategy("ema crossover with rsi confirm", overlay=true, initial_capital=100000, currency=currency.USD, calc_on_order_fills=true, calc_on_every_tick=true)

// User Inputs for EMAs and RSI- 1