
Overview
The Madrid Ribbon RSI-Enhanced Multi-Timeframe EMA Trend Strategy is a comprehensive quantitative trading system that cleverly combines a moving average ribbon system (Madrid Ribbon) with a Relative Strength Index (RSI) filter, providing a dual confirmation mechanism for trend identification and trade execution. The core of this strategy involves monitoring a ribbon structure formed by multiple exponential moving averages (EMAs) of different periods (from 5 to 90), while incorporating the RSI indicator as a filtering condition to effectively reduce false signals. The strategy includes built-in automated trading functionality with preset profit targets and stop losses, determining market trend direction and strength by counting the number of green and red moving averages, which then generates buy and sell signals.
Strategy Principles
The core principle of this strategy is based on the analysis of multi-timeframe moving average clusters and the filtering effect of the RSI indicator:
-
Multi-Timeframe Moving Average Ribbon System: The strategy constructs 18 moving averages ranging from 5 to 90 periods and compares them with a 100-period baseline. Each moving average is assigned a color identifier based on its direction of change and position relative to the baseline:
- Rising and above the baseline: Lime
- Falling and above the baseline: Maroon
- Falling and below the baseline: Red
- Rising and below the baseline: Green
-
Trend Strength Quantification: The strategy quantifies trend strength by counting the number of green (rising) and red (falling) moving averages:
- When the number of green moving averages ≥ 13, it identifies a strong upward trend
- When the number of red moving averages ≥ 9, it identifies a strong downward trend
-
RSI Filtering Mechanism: To reduce false signals, the strategy incorporates the RSI indicator as a filtering condition:
- Buy signal requires: Green moving averages ≥ 13 and RSI < 30 (oversold territory)
- Sell signal requires: Red moving averages ≥ 9 and RSI > 70 (overbought territory)
-
Risk Management Mechanism: The strategy sets percentage-based profit targets and stop losses:
- Long trades: Profit target at entry price + 0.5%, stop loss at entry price - 1%
- Short trades: Profit target at entry price - 0.5%, stop loss at entry price + 1%
-
Capital Management: The strategy allows users to set initial capital and automatically calculates position size based on the current price.
Strategy Advantages
-
Multiple Confirmation Mechanism: By combining the moving average ribbon system with the RSI indicator, the strategy provides multiple confirmation mechanisms, significantly reducing the possibility of false signals. When both the moving average cluster and RSI simultaneously meet the conditions, the reliability of the signal is greatly improved.
-
Trend Strength Quantification: Unlike simple crossover strategies, this strategy quantifies trend strength by counting the number of different colored moving averages, making trading decisions more objective and data-driven.
-
Visualized Trading Signals: The strategy clearly displays signals on the chart through background color changes and shape markers, allowing traders to intuitively identify potential trading opportunities.
-
Built-in Risk Management: The strategy integrates profit target and stop loss mechanisms by default, with clear presets for maximum profit and loss on each trade, effectively controlling risk exposure.
-
High Adaptability: The strategy allows users to choose between EMA or SMA, which can be flexibly adjusted according to different market environments. EMAs are more sensitive to recent price changes, while SMAs are smoother, with different settings suitable for different market conditions.
-
Comprehensive Market State Monitoring: By monitoring 18 moving averages of different periods, the strategy can comprehensively capture market dynamics, reducing the blind spots that might be caused by single timeframe analysis.
Strategy Risks
-
Trend Reversal Delay: Because the strategy relies on multiple moving averages, there may be a lagged response when trends rapidly reverse, leading to less-than-ideal entry or exit timing. To address this risk, consider adding shorter-period indicators or adjusting RSI parameters to increase the strategy's sensitivity to market changes.
-
Strict Filtering Conditions Missing Opportunities: The RSI filtering conditions are set quite strictly (< 30 and > 70), which may miss some potential trading opportunities. Users can adjust the RSI thresholds according to specific market characteristics, such as relaxing the buy condition to RSI < 40 and the sell condition to RSI > 60.
-
Limitations of Fixed Percentage Profit Targets and Stop Losses: The strategy uses fixed percentage settings for profit targets and stop losses (0.5% and 1%), which may not be flexible enough in markets with different volatility. It is recommended to dynamically adjust profit target and stop loss levels based on the Average True Range (ATR) of the asset.
-
Ranging Market Risk: During market consolidation phases, moving averages may frequently intersect, causing signal confusion. This can be mitigated by adding additional range detection mechanisms (such as the ADX indicator) to avoid excessive trading in low-volatility environments.
-
Parameter Sensitivity: Strategy performance is sensitive to parameter selection (such as moving average periods and RSI length). Inappropriate parameter selection may lead to poor strategy performance. It is recommended to conduct thorough parameter optimization and backtesting before live implementation.
Strategy Optimization Directions
-
Dynamic Profit Target and Stop Loss Mechanism: Replace fixed percentage profit targets and stop losses with the ATR indicator to better adapt to changes in market volatility. For example, set stop loss at 1.5ATR and profit target at 1ATR, making risk management more flexible and market-adaptive.
-
Add Trend Strength Filter: Introduce the ADX indicator to measure trend strength, trading only in strong trend environments where ADX > 25, avoiding too many false signals in weak trend or ranging markets.
-
Optimize RSI Parameters: The current strategy uses the standard 14-period RSI. Consider adjusting the RSI period based on specific asset characteristics and timeframes, or use a dual RSI system (checking both short-period and long-period RSI) to reduce false signals.
-
Incorporate Volume Confirmation: Add a volume analysis dimension to ensure sufficient market participation when signals occur, increasing the reliability of trading signals. For example, require buy signals to coincide with volume above the N-day average level.
-
Implement Dynamic Position Sizing: Adjust position size dynamically based on trend strength (the number of green or red moving averages), increasing positions in stronger trends and reducing positions in weaker trends, optimizing capital efficiency.
-
Add Market Environment Filtering: Detect the current market environment through volatility indicators (such as VIX or ATR), adjusting strategy parameters or pausing trading in high-volatility environments, reducing risk under extreme market conditions.
Summary
The Madrid Ribbon RSI-Enhanced Multi-Timeframe EMA Trend Strategy is a comprehensive quantitative trading system that provides traders with a powerful tool for trend identification and trade execution by combining the moving average ribbon structure with RSI filtering mechanisms. The core advantages of the strategy lie in its multiple confirmation mechanisms and trend strength quantification capabilities, making trading decisions more objective and data-driven.
Although the strategy performs well in trending markets, it may face challenges in ranging markets and rapid reversal environments. By introducing dynamic profit targets and stop losses, trend strength filtering, volume confirmation, and other optimization measures, the robustness and adaptability of the strategy can be further enhanced.
This strategy is particularly suitable for medium to long-term trend traders, capable of finding high-probability trading opportunities across various market environments through reasonable parameter adjustments and risk management. However, any trading strategy needs to match the trader's risk preference and investment objectives, so thorough backtesting and optimization are recommended before live implementation.
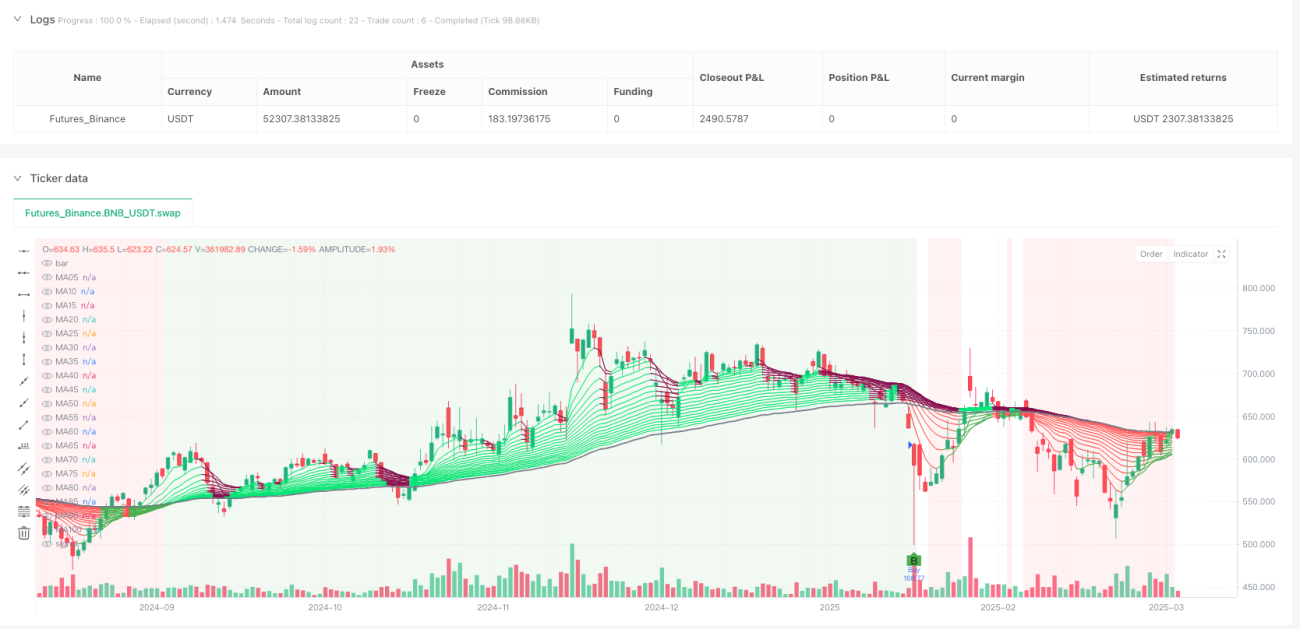
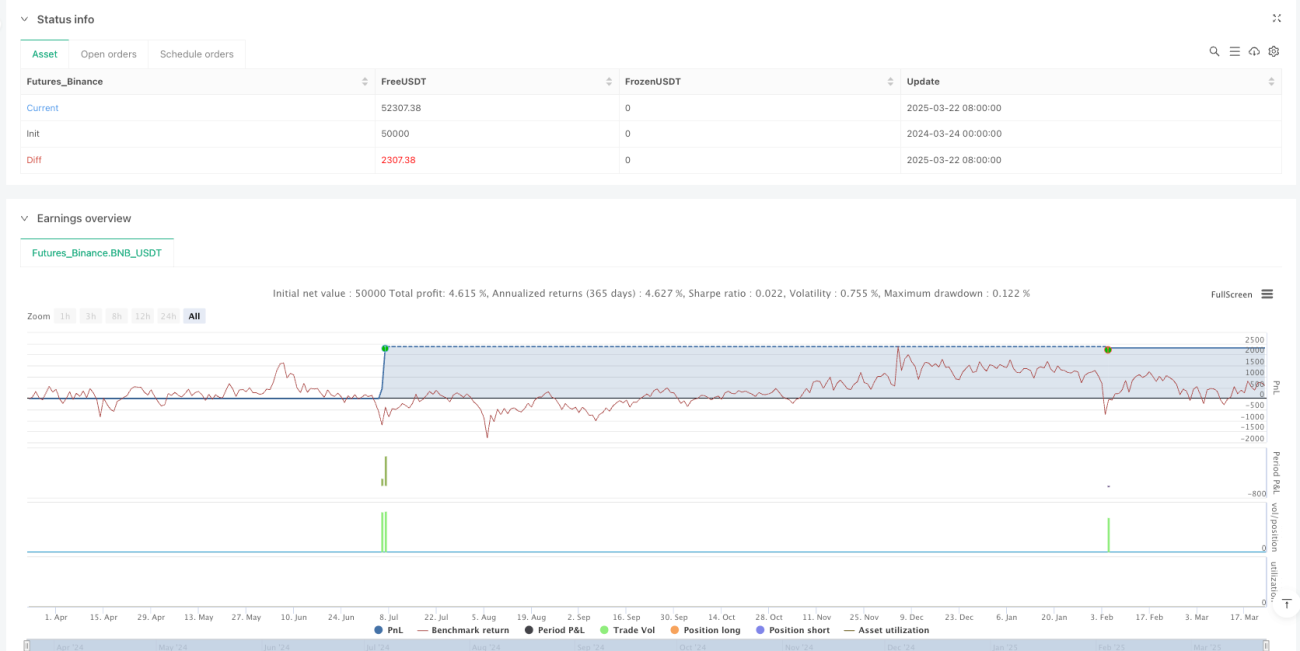
/*backtest
start: 2024-03-24 00:00:00
end: 2025-03-23 00:00:00
period: 1d
basePeriod: 1d
exchanges: [{"eid":"Futures_Binance","currency":"BNB_USDT"}]
*/

//@version=5
strategy("Madrid Ribbon Strategy with Backtesting", shorttitle="Madrid Ribbon Strat", overlay=true, default_qty_type=strategy.cash, default_qty_value=100000)

// Inputs- 1