
Overview
This strategy is a comprehensive quantitative trading system that aims to capture strong market trends and achieve high returns through multi-level indicator confirmation and strict trading condition filtering. The core logic is based on a collaborative confirmation mechanism of multiple indicators, including five Exponential Moving Averages (EMAs) of different periods, Relative Strength Index (RSI), Moving Average Convergence Divergence (MACD), and volume analysis, combined with market trend judgment to form a complete multi-dimensional analysis framework. The strategy employs a high entry threshold to ensure trade quality, while setting conservative stop-loss and aggressive take-profit ratios to achieve high returns under controlled risk.
Strategy Principles
The technical implementation of the strategy is based on comprehensive judgment from a multi-indicator system:
-
Multi-period Moving Average System: Uses 5 different period (10, 20, 50, 100, 200) exponential moving averages, forming a complete trend analysis system from short to long term. Entry signals require price to be above all medium and long-term moving averages, ensuring trading in strong trends.
-
Trend Confirmation Mechanism: Determines the macro trend direction of the current market by calculating the midpoint between the highest and lowest prices within 50 periods, only trading in the corresponding direction when the trend is clear.
-
Momentum and Divergence Analysis: Uses the RSI indicator to monitor market momentum, only going long when RSI is in the strong zone (>55) and short when in the weak zone (<45), avoiding counter-trend trading.
-
Signal Confirmation System: Uses MACD golden cross/death cross as additional trade confirmation conditions, ensuring consistency of momentum and trend.
-
Volume-Price Combined Analysis: Introduces volume conditions, requiring the volume when trading signals appear to be at least 1.5 times higher than the 20-day average volume, filtering out strong breakouts with market recognition.
Entry conditions combine all the above indicators, triggering a long signal only when the short-term moving average (EMA10) crosses above the medium-term moving average (EMA20), price is above all medium and long-term moving averages, RSI is greater than 55, market is in an uptrend, MACD shows a golden cross, and volume expands. Exit conditions are the opposite, ensuring entry quality and multiple confirmations.
Strategy Advantages
Through in-depth code analysis, this strategy has the following significant advantages:
-
Multiple Filtering Mechanisms: The collaborative confirmation of multiple independent indicators greatly reduces the probability of false signals and improves trading precision.
-
Market Environment Adaptation: The strategy has a built-in market trend judgment mechanism, trading only in favorable market environments, avoiding frequent trading and losses in oscillating markets.
-
Optimized Risk-Reward Ratio: Sets a 2% stop-loss and 100% take-profit, with a risk-reward ratio of 1:50, meaning that even with a lower win rate, the long-term expected value can still be positive.
-
Volume-Price Validation: Through volume condition validation, ensures that trading occurs at moments of high market participation, increasing the reliability of breakouts.
-
Visual Analysis Support: The strategy provides rich visualization of indicators, including graphical display of various period moving averages and MACD indicators, facilitating real-time monitoring and judgment by traders.
-
Capital Management Optimization: The strategy uses 30% of the account value by default for trading, ensuring sufficient position while avoiding the risk of excessive leverage.
Strategy Risks
Despite its multiple advantages, the strategy still has the following potential risks:
-
Over-optimization Risk: The strategy uses numerous conditions for filtering, which may lead to overfitting historical data, and its performance in live trading may not match backtesting results. The solution is to conduct thorough backtesting validation across different time periods and market environments.
-
Signal Scarcity Problem: Strict entry conditions may lead to fewer trading signals, potentially resulting in long periods without trading opportunities in certain market environments. Consider appropriately relaxing certain conditions or adding other trading strategies as supplements.
-
Excessively High Take-Profit Target: The 100% take-profit target set may be difficult to achieve in actual trading, causing most trades to fail to achieve expected returns. It is recommended to dynamically adjust take-profit levels according to different market environments.
-
Moving Average Lag: The strategy heavily uses moving average indicators, which inherently have lag, potentially missing optimal entry points or delaying exits. Consider introducing some leading indicators to balance this disadvantage.
-
Lack of Drawdown Control: The strategy does not set maximum drawdown limits or floating loss closing mechanisms, potentially facing significant losses in rapid market reversals. Adding dynamic stop-loss or setting maximum drawdown limits is recommended.
Strategy Optimization Directions
Based on deep analysis of the strategy, the following are potential optimization directions:
-
Dynamic Parameter Adjustment: Introduce adaptive parameter mechanisms to automatically adjust EMA periods, RSI thresholds, and volume multiples based on market volatility, allowing the strategy to better adapt to different market environments.
-
Phased Position Building and Closing: Improve the current one-time position building model to implement phased position building and phased take-profit, reducing the risk at single price points while securing partial profits.
-
Enhanced Market State Classification: Refine market trend judgment by classifying market states into strong uptrend, weak uptrend, range-bound, weak downtrend, and strong downtrend, applying different trading parameters for different states.
-
Integration of Volatility Indicators: Introduce volatility indicators such as ATR (Average True Range) for dynamic adjustment of stop-loss positions and position sizes, achieving more refined risk management.
-
Optimized Capital Management: Adjust the proportion of funds for each trade based on the Kelly formula or fixed risk model, rather than consistently using 30% of account funds, implementing more scientific capital management.
-
Addition of Time Filtering: Introduce trading time filtering to avoid periods with high volatility but unclear direction, improving trade quality.
-
Introduction of Machine Learning Models: Consider using machine learning methods such as decision trees or neural networks to dynamically assess the reliability of current trading signals based on historical data, serving as additional trade filtering conditions.
Summary
This quantitative trading strategy builds a comprehensive trading decision system through multi-indicator collaborative confirmation. The core advantages of the strategy lie in its strict signal filtering mechanism and clear trading logic, helping to capture high-quality trading opportunities in strong trend markets. Through five EMAs of different periods, RSI momentum indicator, MACD trend confirmation, and volume verification, it forms a multi-layered safety net, effectively reducing the possibility of erroneous trades.
However, the strategy also has potential issues such as over-optimization and signal scarcity, requiring continuous monitoring and adjustment in practical applications. Future optimization directions should focus on improving the strategy's adaptability, including introducing dynamic parameters, phased trading, optimizing capital management, and integrating more dimensions of market information.
By combining trend following with multi-indicator confirmation methods, this strategy provides traders with a quantitative trading framework that balances risk and return, particularly suitable for application in market environments with clear directionality.
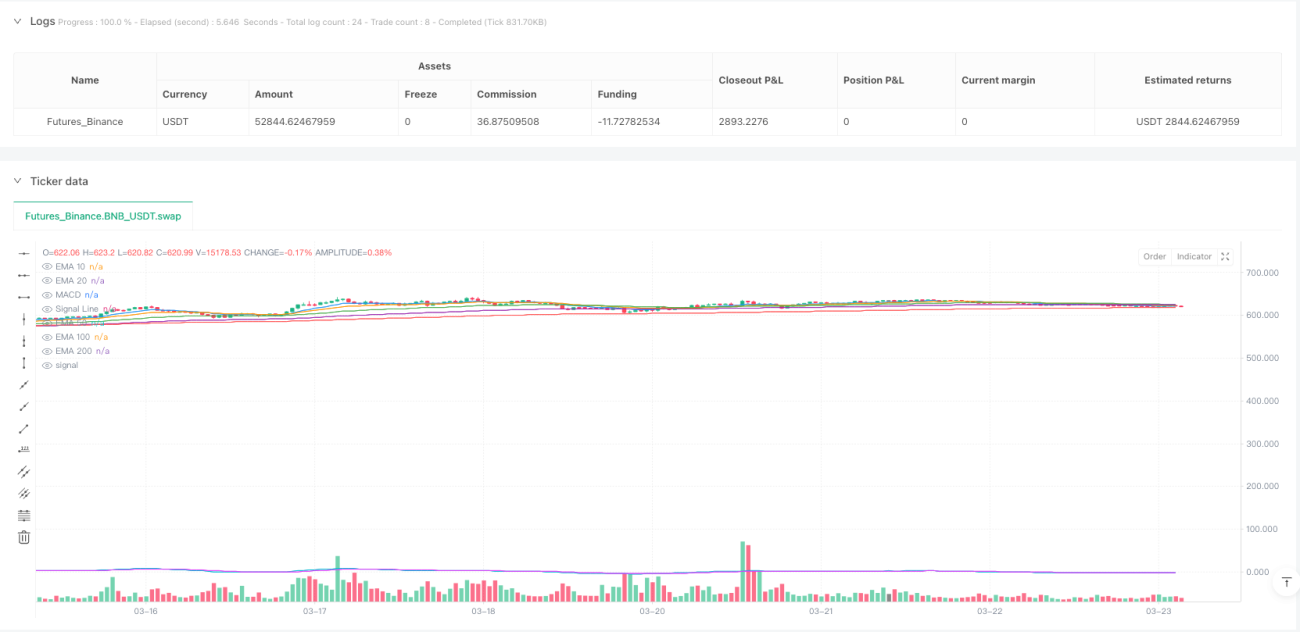
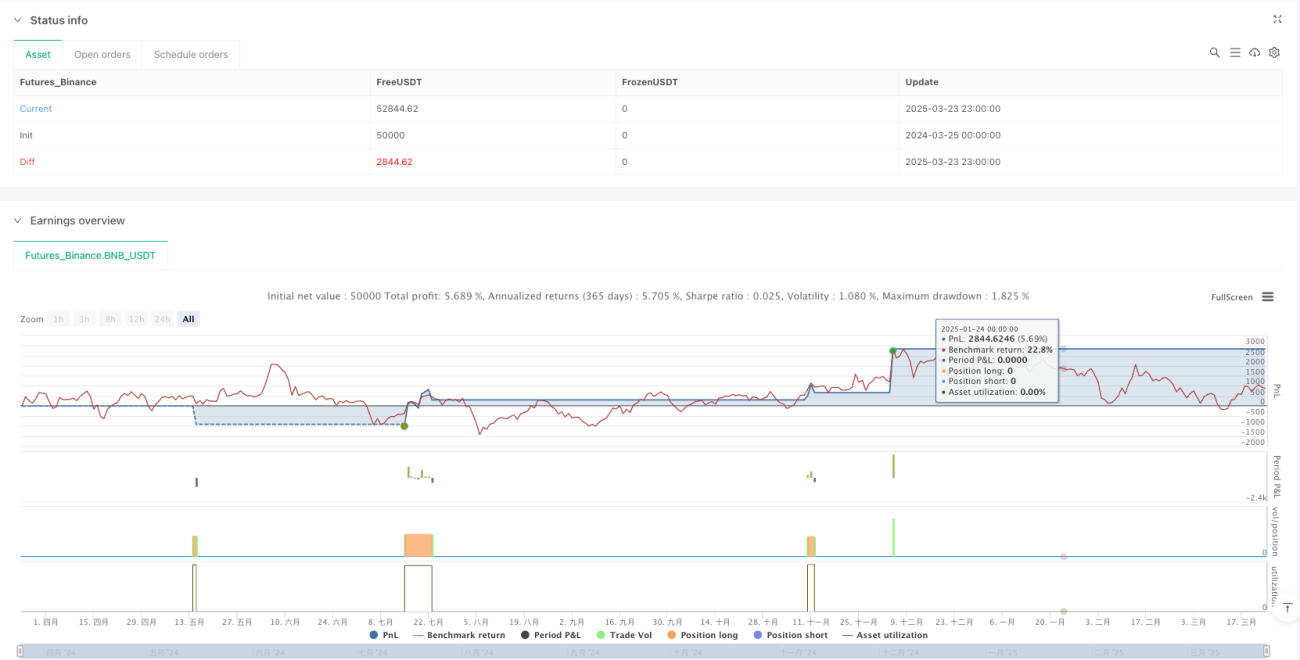
/*backtest
start: 2024-03-25 00:00:00
end: 2025-03-24 00:00:00
period: 1h
basePeriod: 1h
exchanges: [{"eid":"Futures_Binance","currency":"BNB_USDT"}]
*/

//@version=5
strategy("Solana Max Profit Strategy", overlay=true, default_qty_type=strategy.percent_of_equity, default_qty_value=30)

// Definition of Exponential Moving Averages (EMAs)- 1