
Overview
This strategy is a comprehensive trend-following system that integrates three powerful technical indicators: MACD (Moving Average Convergence Divergence), Parabolic SAR (Stop and Reverse), and Supertrend to confirm trading signals. The core concept is to execute trades only when all three indicators simultaneously point in the same direction. By requiring multiple confirmations, the strategy aims to reduce false signals and improve the accuracy and reliability of trades. The strategy supports both long and short trading directions and features clear entry and exit rules.
Strategy Principle
The working principle of this strategy is based on the synergistic action of three key technical indicators:
-
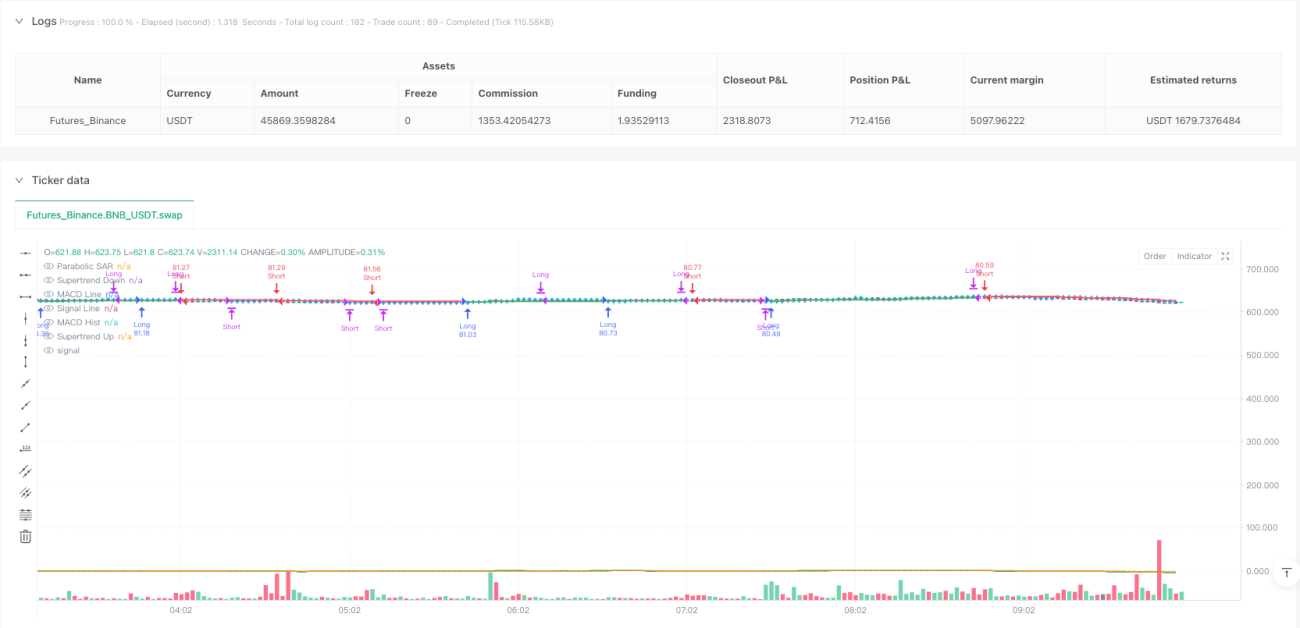
MACD Indicator: Calculates the difference between fast (12-period) and slow (26-period) moving averages, along with a 9-period signal line. When the MACD line crosses above the signal line, it's considered bullish; when it crosses below, it's considered bearish.
-
Parabolic SAR Indicator: This is a dynamic stop-loss indicator that calculates potential price reversal points using parameters (step 0.02, maximum 0.2). When price is above the SAR point, it's considered an uptrend; when price is below, it's considered a downtrend.
-
Supertrend Indicator: Uses a multiple of ATR (Average True Range, set to 3) to determine the main direction of price trends. When the indicator is green, it signals bullish conditions; when red, it signals bearish conditions.
Trading Logic:
-
Long Entry Conditions: Enter long when all three conditions are met:
- MACD line is above the signal line (bullish)
- Closing price is higher than the SAR value (bullish)
- Supertrend indicator is green (bullish)
-
Short Entry Conditions: Enter short when all three conditions are met:
- MACD line is below the signal line (bearish)
- Closing price is lower than the SAR value (bearish)
- Supertrend indicator is red (bearish)
-
Long Exit Conditions: Close long positions when both conditions are met:
- MACD line is below the signal line (bearish)
- Closing price is lower than the SAR value (bearish)
-
Short Exit Conditions: Close short positions when both conditions are met:
- MACD line is above the signal line (bullish)
- Closing price is higher than the SAR value (bullish)
Notably, the strategy allows for some indicator fluctuations during the holding period without immediate exit, such as when MACD changes but the price remains above/below the SAR support or resistance, the strategy continues to hold the position.
Strategy Advantages
-
Multiple Confirmation Mechanism: By requiring consistency across three different indicators for entry, it significantly reduces the possibility of false signals and lowers unnecessary trading frequency.
-
Comprehensive Market Perspective: The strategy integrates three dimensions of market analysis: momentum (MACD), trend direction (Supertrend), and dynamic support/resistance (SAR), providing a more comprehensive market view.
-
Flexible Position Management: When some indicators change but not all reverse, the strategy continues to hold positions, helping to capture longer-term trend movements and avoid premature exit from favorable trades.
-
Clear Entry and Exit Rules: The strategy rules are clear and explicit, leaving no room for subjective judgment, making the trading decision process fully systematic and replicable.
-
Adaptability: Both Supertrend and SAR indicators have adaptive characteristics, automatically adjusting according to market volatility, allowing the strategy to adapt to different market environments.
-
Bidirectional Trading Capability: The strategy supports both long and short positions, creating profit opportunities in different market environments, not limited to one-directional markets.
Strategy Risks
-
Indicator Synchronization Delay: Requiring all three indicators to simultaneously meet conditions may result in delayed entry points, sometimes missing optimal trend entry points, especially in rapidly changing markets.
-
Parameter Sensitivity: The strategy uses multiple parameters (MACD periods, Supertrend ATR factor, SAR step, etc.), making it sensitive to parameter settings. Different parameter combinations may yield significantly different results.
-
Extreme Volatility Risk: In highly volatile markets, the SAR indicator may frequently reverse, causing premature exit from otherwise potentially profitable positions.
-
Poor Performance in Ranging Markets: In sideways or narrow-range market environments, trend indicators may generate frequent false signals, leading to consecutive losing trades.
-
Lack of Stop-Loss Mechanism: The current strategy relies only on indicator reversals for exits, without explicit stop-loss mechanisms, which may lead to larger losses under extreme market conditions.
Mitigation Measures:
- Implement additional stop-loss mechanisms, such as fixed percentage or ATR-multiple stops.
- Adjust parameter settings according to different market conditions, or consider using adaptive parameters.
- Add trading filters, such as only trading in strong trend markets, avoiding trading within volatile ranges.
- Consider adding position management strategies, not using 100% of funds on every signal.
Strategy Optimization Directions
-
Introduce Volatility Filters: Add evaluation of market volatility, such as using ATR indicators or historical volatility, to avoid trading in low-volatility environments where trend indicators typically perform poorly.
-
Add Stop-Loss Mechanisms: Implement ATR-based dynamic stop-losses or fixed percentage stops to limit maximum losses per trade and improve the strategy's risk-adjusted returns.
-
Optimize Parameter Settings: Backtest parameter combinations across different time periods and market conditions to find more robust parameter settings, or even consider implementing adaptive parameter systems.
-
Add Timeframe Confirmation: Introduce multi-timeframe analysis, such as requiring the trend direction of longer timeframes to align with the trading timeframe, to increase trade robustness.
-
Implement Position Sizing: Adjust position size based on signal strength, market volatility, or risk models, rather than using 100% of funds for each trade.
-
Add Trading Time Filters: Avoid trading during important economic data releases or periods of low market liquidity to reduce the impact of abnormal volatility.
-
Consider Partial Profit-Taking: During trend development, implement a stepped profit-taking strategy to secure partial profits while allowing remaining positions to continue following the trend.
Implementing these optimizations can significantly improve the strategy's adaptability and performance, especially across different market environments. By balancing the strictness and flexibility of entry conditions, and strengthening risk management, a more robust trading system can be created.
Summary
The Multi-Indicator Confirmation Trading System is a comprehensive trend-following system that verifies trading signals by integrating three powerful technical indicators: MACD, Parabolic SAR, and Supertrend. The core advantage of this strategy lies in its multiple confirmation mechanism, which significantly reduces false signals and improves trade quality. Meanwhile, its flexible holding rules allow for capturing longer-term market trends.
However, the strategy also faces challenges such as parameter sensitivity and potential entry delays. By implementing the suggested optimization measures, such as adding stop-loss mechanisms, optimizing parameter settings, implementing position sizing, and adding market environment filters, the strategy's robustness and performance can be further enhanced.
Overall, this is a systematic trading strategy with clear logic and explicit rules, particularly suitable for traders who pursue signal quality over quantity and tend to capture medium to long-term trends rather than short-term fluctuations. By deeply understanding the principles and limitations of this strategy, traders can customize and optimize it according to their risk preferences and trading objectives.
- 1