
Overview
The Quarterly EMA Pullback Trading System is a trading strategy based on price retracements to exponential moving average (EMA) support levels, specifically designed for quarterly swing trading. This strategy primarily focuses on price pullbacks to key EMA support levels (10 and 21-day) with RSI confirmation to capture high-probability long opportunities. The core logic lies in utilizing short-term and medium-term EMAs as dynamic support levels, entering positions when prices retrace to these levels with RSI below 40, and implementing flexible stop-loss and profit strategies to manage risk and achieve consistent quarterly returns.
Strategy Principle
The core principle of this strategy is to leverage the dynamic support characteristics of EMAs and RSI oversold signals to build a trading system. Analyzing the code, the strategy includes the following key components:
-
Trend Confirmation System: Uses 10-day and 21-day EMAs to establish trend direction, effectively filtering short-term market noise while reflecting medium-term trend status.
-
Entry Condition Logic:
- Price crosses above the 10-day EMA or 21-day EMA from below (crossAboveEMA10 or crossAboveEMA21)
- RSI indicator is below 40 (rsi < 40), indicating the price is in a relatively oversold region
-
Multi-level Exit Mechanism:
- Quick Profit Exit: When price rapidly rises above 8% of the 10-day EMA (close > ema10 * 1.08)
- Trend Breakdown Exit: When price falls back below the 10-day EMA (crossBelowEMA10)
-
Dynamic Stop-Loss Setting:
- 15% stop-loss based on entry price (entryPrice * 0.85)
- Stop-loss range adjusts dynamically with changes in entry price
The code uses a global variable (var float entryPrice) to store the entry price, ensuring correct calculation of the stop-loss price, and uses the strategy.exit function to execute stop-loss operations, reflecting the strategy's emphasis on risk management.
Strategy Advantages
Through detailed analysis of the strategy's code implementation, the following significant advantages can be summarized:
-
Trend and Retracement Combination: The strategy doesn't simply chase price rises but waits for pullback opportunities in strong trends, improving the value of entry points and reducing the risk of chasing high prices.
-
Multiple Confirmation Mechanism: Entry requires both price crossing EMA and RSI below 40, reducing false signals.
-
Flexible Exit Strategy: Designed with two exit conditions for different market situations, allowing for profit-locking during rapid price increases and quick exits when trends weaken.
-
Comprehensive Risk Control System: Clear stop-loss percentage (15%) ensures limited losses per trade, with stop-loss positions dynamically adapted based on entry prices.
-
Low-Frequency Trading Characteristics: Quarterly operation frequency reduces trading costs and psychological pressure, suitable for non-full-time traders.
-
Concise and Efficient Code Implementation: Clear strategy logic, optimized code structure, utilizing TradingView's built-in functions like ta.ema and ta.crossover for improved computational efficiency.
-
Integrated Alert System: Uses alertcondition function to set buy and sell signal reminders that can integrate with communication tools like Telegram, improving trade execution efficiency.
Strategy Risks
Despite numerous advantages, the code analysis also reveals the following potential risks and limitations:
-
EMA Lag Risk: EMAs are inherently lagging indicators, potentially causing delayed entry signals in volatile markets, missing optimal entry points, or resulting in lagged stop-losses.
-
Fixed RSI Threshold Issue: The strategy uses a fixed RSI threshold (40) without considering the relative performance differences of RSI in different market environments; in strong markets, RSI may remain high for extended periods.
-
Large Stop-Loss Percentage: A 15% stop-loss percentage may be suitable for high-volatility assets but could be excessive for low-volatility assets, leading to losses beyond reasonable ranges.
-
Lack of Market Environment Filtering: The strategy lacks a market environment judgment mechanism, potentially generating excessive false signals in bear markets or sideways markets.
-
Simplified Exit Mechanism: Relying solely on price position relative to EMA for exit decisions without considering risk-reward ratios or time factors may result in lost potential profits.
-
Backtest Overfitting Risk: No measures against overfitting are seen in the code; the strategy may excessively adapt to historical data, with live performance potentially not matching backtest results.
To address these risks, the following solutions are recommended:
- Incorporate additional market environment filters, such as volatility indicators or market structure analysis
- Adopt dynamic RSI thresholds that adjust based on market conditions
- Optimize stop-loss percentages, considering ATR-based dynamic stop-losses
- Add time filters to avoid trading in inefficient market environments
Strategy Optimization Directions
Based on code analysis, the strategy has several potential optimization directions:
-
Dynamic Parameter Optimization:
pine// Original code uses fixed parameters ema10 = ta.ema(close, 10) ema21 = ta.ema(close, 21)Can be improved to allow user-adjustable parameters:
pineemaFastLength = input.int(10, "Fast EMA Length") emaSlowLength = input.int(21, "Slow EMA Length") ema_fast = ta.ema(close, emaFastLength) ema_slow = ta.ema(close, emaSlowLength)This allows the strategy to adapt to different market environments and personal trading styles.
-
Dynamic Stop-Loss Mechanism:
pine// Original fixed percentage stop-loss stopLoss = entryPrice * 0.85Can be optimized to ATR-based dynamic stop-loss:
pineatrPeriod = input.int(14, "ATR Period") atrMultiplier = input.float(2.0, "ATR Multiplier") atr = ta.atr(atrPeriod) stopLoss = entryPrice - atr * atrMultiplierThis method better adapts to market volatility, providing more precise risk control.
-
Market Environment Filtering:
Add market state assessment code:pine// Market trend strength assessment ema50 = ta.ema(close, 50) ema200 = ta.ema(close, 200) strongUptrend = ema50 > ema200 and close > ema50 // Only trade in strong trends enterLong = (crossAboveEMA10 or crossAboveEMA21) and (rsi < 40) and strongUptrendThis improvement can reduce error signals in weak or sideways markets.
-
Dynamic Profit Targets:
pine// Set dynamic profit targets combining ATR takeProfitLevel = entryPrice + (atr * 3) exitProfit = close >= takeProfitLevelThis automatically adjusts profit targets based on market volatility, setting smaller targets in low-volatility environments and larger targets in high-volatility environments.
-
Volume Filter:
pine// Add volume confirmation volumeCondition = volume > ta.sma(volume, 20) * 1.5 enterLong = (crossAboveEMA10 or crossAboveEMA21) and (rsi < 40) and volumeConditionVolume confirmation helps avoid entry in low-liquidity environments, improving signal quality.
These optimization directions aim to enhance the strategy's adaptability, risk control capability, and signal quality, maintaining stable performance across different market environments.
Summary
The Quarterly EMA Pullback Trading System is a structurally clear and logically rigorous medium-term trading strategy that captures market retracement opportunities for long positions through the combined use of EMA and RSI indicators within a technical analysis framework. The strategy's core advantage lies in its complete system for entry, exit, and risk control, particularly suitable for investors seeking stable quarterly returns without frequent trading.
The strategy's main feature is its focus on technical retracements in strong assets, screening entry opportunities through dynamic support levels provided by EMAs and RSI oversold signals, while setting multi-level exit mechanisms and clear stop-loss strategies to balance returns and risks. Despite limitations such as EMA lag and fixed parameters, the strategy's robustness and adaptability can be further enhanced through the optimization directions proposed in this article, including dynamic parameter adjustment, ATR-based risk management, and market environment filtering.
From a programming implementation perspective, the strategy features clear code structure, improved computational efficiency through TradingView Pine Script language's built-in functions, and good programming practices through global variable management of trading states. Overall, this is a trading system that balances technical analysis theory with practicality and, with reasonable optimization, can become a powerful tool for professional traders.
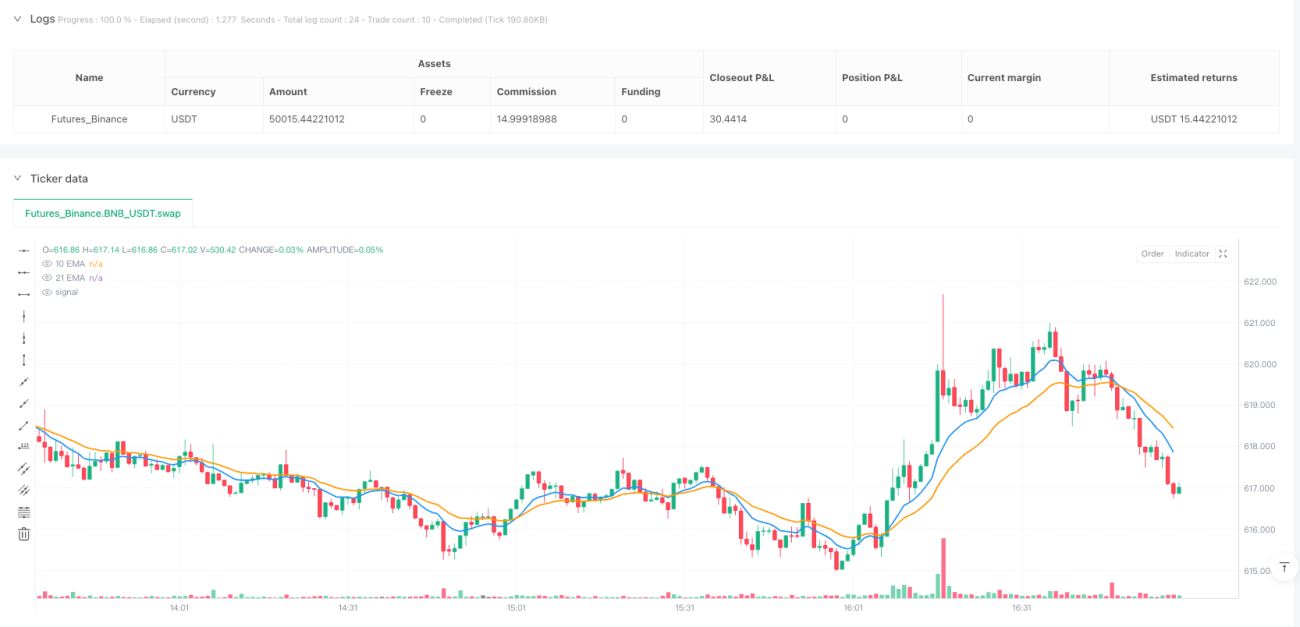
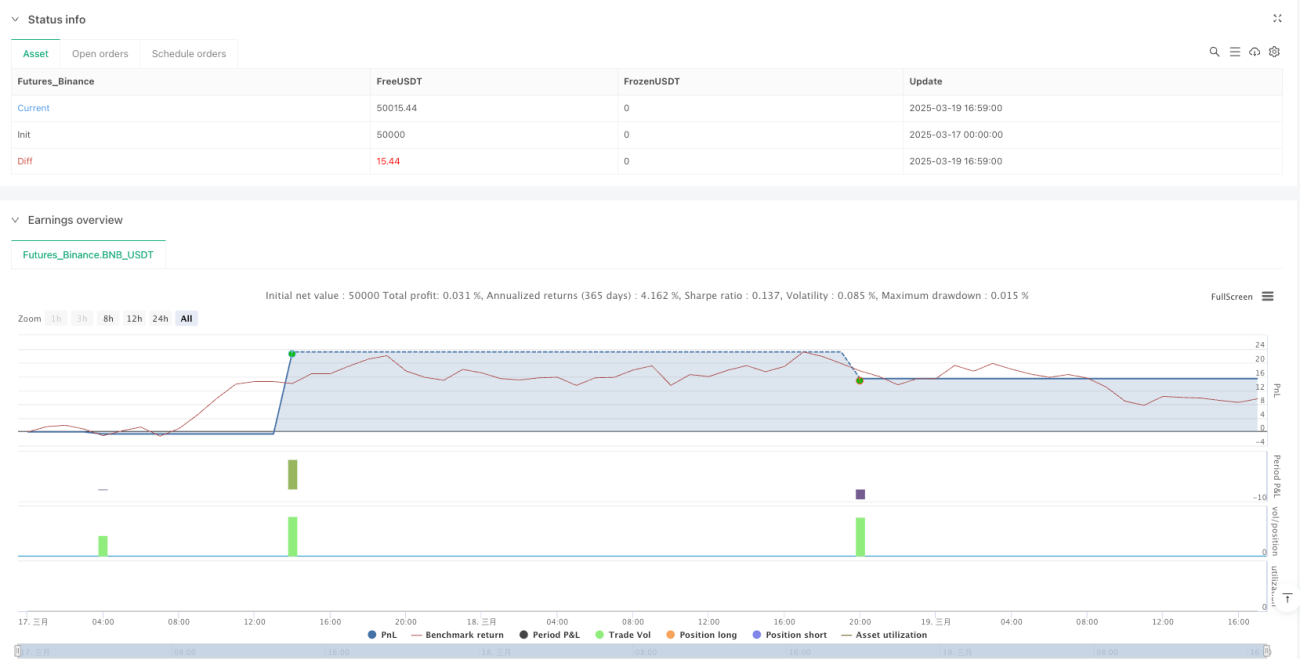
/*backtest
start: 2025-03-17 00:00:00
end: 2025-03-19 17:00:00
period: 1m
basePeriod: 1m
exchanges: [{"eid":"Futures_Binance","currency":"BNB_USDT"}]
*/

//@version=5
strategy("Quarterly EMA Strategy", overlay=true, default_qty_type=strategy.percent_of_equity, default_qty_value=10)

// 🎯 DEFINE INDICATORS- 1