
Overview
This Multi-Level Technical Indicator Momentum Trading Strategy is a quantitative trading method that combines multiple technical analysis tools. It integrates the traditional MACD (Moving Average Convergence Divergence) with volume strength analysis and EMA (Exponential Moving Average) signal systems to form a relatively comprehensive trading decision framework. Through the combination of multi-level technical indicators, this strategy not only focuses on price momentum changes but also uses trading volume as a confirmation signal, while leveraging EMA crossovers of different periods to provide additional trading signals, thereby improving the accuracy and reliability of trading decisions.
Strategy Principles
The core principles of this strategy are based on the collaborative work of three main technical components:
-
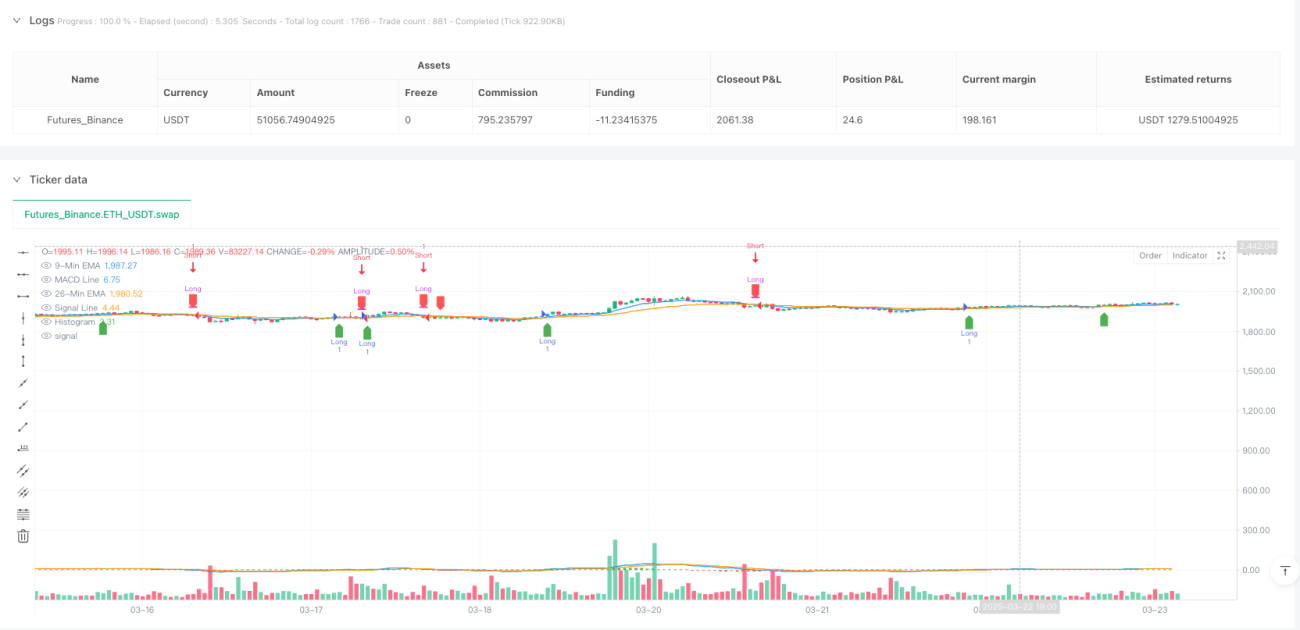
Enhanced MACD Analysis: The strategy first calculates the traditional MACD indicator by subtracting the slow EMA (26-period) from the fast EMA (9-period) to get the MACD line, then applies a 9-period EMA smoothing to the MACD line to obtain the signal line, and calculates the histogram between the two lines. This part captures the changing trends in price momentum.
-
Volume Strength Confirmation: The strategy introduces a volume strength indicator, calculated as the ratio of current volume to its 20-period moving average. When the volume strength is greater than 1, it indicates that the current volume is above average, enhancing the credibility of the price movement.
-
EMA Crossover Signal System: The strategy also uses the crossover of 9-period and 26-period EMAs as additional trading signals. This part captures turning points in medium to short-term price trends.
Buy signals are triggered in two scenarios: when the 9-period EMA crosses above the 26-period EMA, or when the MACD line crosses above the signal line with volume strength greater than 1. Sell signals work in the opposite way: when the 9-period EMA crosses below the 26-period EMA, or when the MACD line crosses below the signal line with volume strength greater than 1. This multi-condition trigger mechanism enhances the reliability of signals.
Strategy Advantages
-
Multi-Level Confirmation Mechanism: The strategy combines momentum indicators (MACD), trend indicators (EMA), and volume indicators to form a multi-level confirmation mechanism, reducing false signals that might come from a single indicator.
-
Volume Confirmation Enhances Reliability: By introducing volume strength as a confirmation factor, the strategy can filter out some price fluctuations that are not supported by sufficient trading volume, improving signal quality.
-
Flexible Parameter Settings: The strategy allows adjustment of multiple parameters, including fast EMA length, slow EMA length, MACD signal smoothing, and volume strength calculation period, making it adaptable to different market environments and trading instruments.
-
Intuitive Graphical Interface: The strategy clearly marks buy and sell signals on the chart and displays MACD lines, signal lines, histograms, and EMA lines, making it easier for traders to intuitively understand market conditions and trading logic.
-
Two-Way Trading Opportunities: The strategy supports both long and short positions, capturing trading opportunities in both upward and downward trends, maximizing market participation.
Strategy Risks
-
False Signals in Oscillating Markets: In sideways, oscillating markets, MACD and EMA crossovers may produce frequent false signals, leading to overtrading and losses. The solution is to add filtering conditions, such as only trading in clear trends or adding signal confirmation mechanisms.
-
Parameter Sensitivity: The strategy's effectiveness is sensitive to parameter settings, with different parameter combinations performing significantly differently in various market environments. It is recommended to find the most suitable parameter combination for specific markets through backtesting optimization and regularly reassess parameter effectiveness.
-
Impact of Volume Anomalies: In some cases, trading volume may experience abnormal fluctuations due to special events, affecting the effectiveness of the volume strength indicator. Consider adding volume anomaly detection mechanisms or adjusting the calculation method for volume strength.
-
Delay Issues: As lagging indicators, MACD and EMA may not respond quickly enough in rapidly changing markets. Consider introducing some leading indicators or reducing EMA period lengths to improve response speed.
-
Lack of Risk Management Mechanisms: The current strategy does not have built-in stop-loss and position management functions, which may expose traders to excessive risk in live trading. It is recommended to add stop-loss mechanisms and features to adjust position size based on market volatility.
Strategy Optimization Directions
-
Add Trend Filters: Introduce trend determination mechanisms from higher time frames, such as adding 50-period or 200-period moving averages as trend direction filters, only opening positions in the direction of the main trend to avoid counter-trend trading.
-
Optimize Volume Indicators: Consider using more complex volume indicators, such as OBV (On-Balance Volume) or money flow indicators, to more accurately measure the relationship between volume and price changes.
-
Add Volatility Adjustment Mechanisms: Introduce ATR (Average True Range) or other volatility indicators to adjust position size and stop-loss range based on market volatility, reducing risk exposure in high-volatility environments.
-
Implement Dynamic Parameter Optimization: Develop adaptive parameter adjustment mechanisms that automatically adjust MACD and EMA period parameters based on market conditions, allowing the strategy to better adapt to different market phases.
-
Integrate Other Technical Indicators: Consider introducing other technical indicators such as RSI (Relative Strength Index) or Bollinger Bands to provide additional confirmation signals or identify overbought/oversold conditions, optimizing entry and exit timing.
-
Improve Trade Execution Logic: Design more complex entry and exit rules, such as partial position building and phased profit-taking, to optimize capital management and risk control.
Conclusion
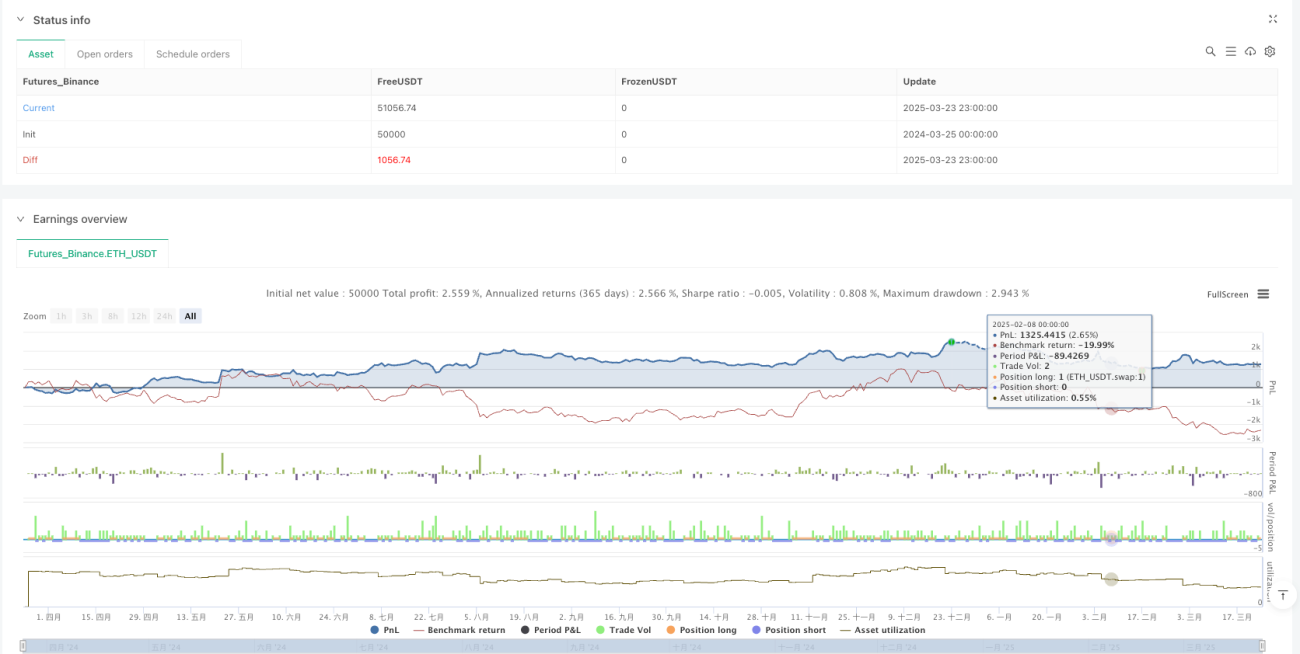
This Multi-Level Technical Indicator Momentum Trading Strategy constructs a relatively comprehensive trading decision system by integrating MACD, volume strength analysis, and EMA crossover signals. The strategy leverages the synergistic effects of multi-level technical indicators to improve the reliability and accuracy of trading signals. Although this strategy performs well in markets with clear trends, it still carries certain risks in oscillating markets or when parameters are improperly set.
Future optimizations can focus on enhancing trend filtering, improving volume analysis, adding risk management mechanisms, and implementing parameter adaptation. Through these optimizations, the strategy has the potential to further improve trading efficiency and risk-adjusted returns while maintaining its multi-level confirmation advantages. Most importantly, traders should consider market conditions and their own risk tolerance when using this strategy, setting parameters reasonably and adding necessary risk control measures.
- 1