
Overview
The Relative Strength Index (RSI) Overbought Oversold Quantitative Trading Strategy is an automated trading system based on the RSI technical indicator. The core concept of this strategy is to identify overbought and oversold market conditions and execute trades when the RSI crosses specific threshold values. It generates buy signals when RSI crosses above 30 (oversold zone) and sell signals when RSI crosses below 70 (overbought zone). The strategy is designed for the MetaTrader platform with automatic execution through Pine Connector, particularly suitable for volatile markets like Bitcoin.
Strategy Principles
This strategy operates based on the RSI (Relative Strength Index), a classic technical indicator. RSI is a momentum oscillator that measures the speed and magnitude of price changes. RSI values range between 0 and 100, with conventional interpretations being:
- RSI below 30 indicates an oversold market condition, suggesting a potential rebound
- RSI above 70 indicates an overbought market condition, suggesting a potential decline
The trading logic is as follows:
- Buy signal: When RSI crosses above 30 (ta.crossover(rsi, 30))
- Sell signal: When RSI crosses below 70 (ta.crossunder(rsi, 70))
- Close long position: When RSI crosses above 70 (ta.crossover(rsi, 70))
- Close short position: When RSI crosses below 30 (ta.crossunder(rsi, 30))
The strategy uses the standard 14-period RSI calculated on closing prices. It is implemented on the TradingView platform with MetaTrader integration functionality, allowing users to enable automated trading by entering a license ID. Trade risk is controlled through a fixed lot size parameter.
Strategy Advantages
- Simplicity: The strategy is based on the widely-used RSI indicator with clear logic that is easy to understand and implement.
- Mean Reversion Characteristics: This is essentially a counter-trend strategy that seeks reversal opportunities during market extremes, helping capture turning points in volatile markets.
- Automated Execution: Integration with MetaTrader through Pine Connector supports fully automated trading, reducing manual intervention and emotional factors.
- Visual Support: The strategy includes RSI chart plotting and visual marking of overbought/oversold lines for intuitive market monitoring.
- Flexible Risk Control: Through adjustable lot size parameters, users can modify position sizes according to their risk tolerance.
- Comprehensive Alert System: Alert conditions are set for all trading signals (entries and exits), ensuring traders don't miss important signals.
- Multi-Market Application: While the code comments mention good performance on BTC 1M timeframe, theoretically, the strategy can be applied to any liquid market.
Strategy Risks
- Ranging Market Risk: In sideways, choppy markets, RSI may frequently cross overbought and oversold zones, leading to overtrading and commission erosion.
- Trending Market Risk: In strong trend markets, RSI may remain in overbought or oversold territories for extended periods, causing premature exits or missed significant trends.
- False Breakout Risk: RSI may exhibit false breakouts, briefly crossing thresholds before immediately reversing, triggering unnecessary trades.
- Parameter Sensitivity: The default RSI parameters (14 periods, 30/70 thresholds) may not be suitable for all markets and timeframes, requiring optimization for specific situations.
- Lack of Stop-Loss Mechanism: The current strategy has no built-in stop-loss mechanism, potentially facing significant losses in extreme market conditions.
- Single Indicator Dependency: Relying solely on the RSI indicator for decision-making lacks multi-dimensional analysis, increasing the possibility of false signals.
Solutions:
- Introduce additional filtering conditions like trend indicators or volume confirmation
- Add stop-loss and take-profit mechanisms to control single trade risk
- Optimize RSI parameters for different markets and timeframes
- Reduce position sizing, recommended not to exceed 5% of account capital
Strategy Optimization Directions
-
Multi-Indicator Integration: Combine with other technical indicators such as moving averages, MACD, or Bollinger Bands to build more comprehensive entry conditions and reduce false signals. For example, only consider long signals when price is above a long-term moving average.
-
Dynamic Threshold Adjustment: Replace fixed 30/70 thresholds with dynamic thresholds that automatically adjust based on market volatility. Use narrower threshold ranges (like 40/60) in low-volatility markets and wider ranges (like 20/80) in high-volatility markets.
-
Time Filters: Add time filtering conditions to avoid low-volatility periods or known major news release times, improving signal quality.
-
Money Management Optimization: Replace fixed lot sizes with dynamic position sizing based on account equity percentage or ATR-based position calculation methods for better risk management.
-
Stop-Loss and Take-Profit Mechanisms: Add price-based or percentage-based stop-loss and take-profit mechanisms to avoid excessive losses on individual trades or missing profit-taking opportunities.
-
Trend Filtering: Add trend identification functionality to accept RSI signals in trend direction while ignoring or raising thresholds for counter-trend signals.
-
RSI Period Optimization: Test different RSI calculation periods for various trading instruments and timeframes to find optimal parameter combinations.
These optimization directions primarily aim to improve signal quality, reduce false signals, and strengthen money management and risk control, enabling the strategy to maintain stability across different market environments.
Summary
The Relative Strength Index (RSI) Overbought Oversold Quantitative Trading Strategy is an automated trading system based on classic technical analysis principles. The strategy uses the RSI indicator to identify potential market reversal points, seeking long opportunities in oversold areas and short opportunities in overbought areas. While the strategy logic is simple and clear, its effectiveness largely depends on market environment and parameter optimization.
This strategy is best suited for markets with significant volatility but within certain ranges, such as cryptocurrency markets. Investors using this strategy should pay attention to market environment compatibility and consider introducing additional filtering conditions and risk management mechanisms. Through reasonable optimization and extension, this basic strategy can be developed into a more robust trading system.
As an entry-level technical analysis strategy, the RSI Overbought Oversold Strategy provides a good starting point for understanding and applying the basic principles of quantitative trading. However, investors should not overly rely on a single indicator or any automated strategy, but rather combine it with broader market analysis and sound risk management principles to build a comprehensive trading approach.
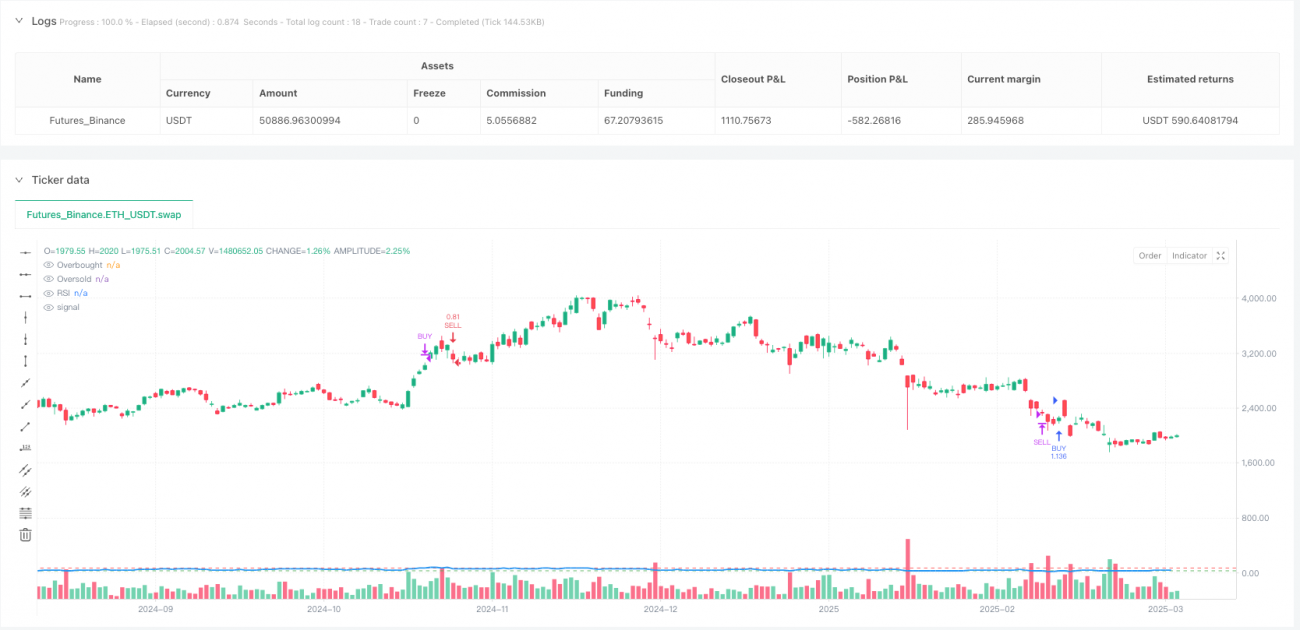
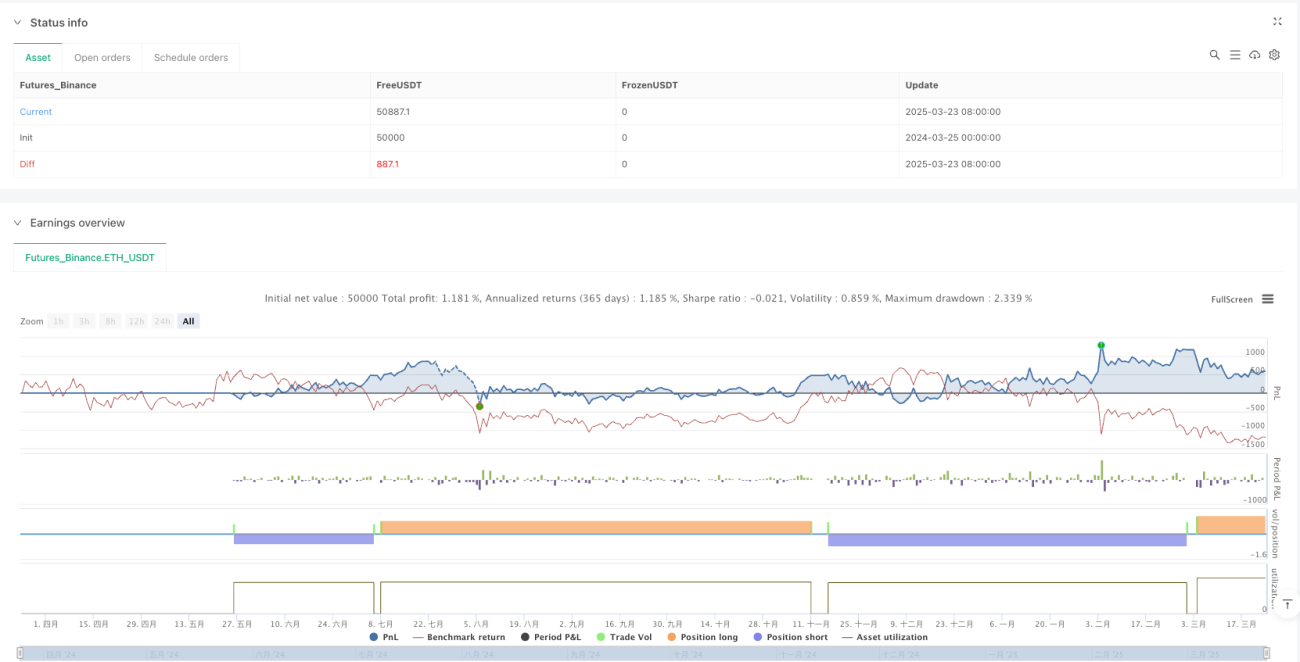
/*backtest
start: 2024-03-25 00:00:00
end: 2025-03-24 00:00:00
period: 1d
basePeriod: 1d
exchanges: [{"eid":"Futures_Binance","currency":"ETH_USDT"}]
*/

// Risk Settings
pc_id = input.string(title='License ID', defval='', group='MT4/5 Settings', tooltip='This is your license ID')
pc_risk = input.float(title='Lots', defval=0.1, step=0.1, minval=0, group='MT4/5 Settings', tooltip='Lot Size')
pc_prefix = input.string(title='MetaTrader Symbol', defval='', group='MT4/5 Settings', tooltip='This is your broker\'s MetaTrader symbol')- 1