
Overview
The Liquidity Grab & Smart Money Divergence Indicator Combination Strategy is a quantitative trading approach based on technical analysis that identifies liquidity grab events and smart money divergence signals in the market, combined with trend confirmation and dynamic risk management systems for trading decisions. The core idea of this strategy is to capture structural market turning points—key moments when large institutional investors (smart money) may change direction after absorbing liquidity, thereby seizing high-probability entry opportunities.
Strategy Principles
The strategy operates based on multiple technical indicators and market structure analysis:
-
Liquidity Grab Identification: Monitors whether price sweeps recent highs/lows (defined by the lookback parameter) followed by a reversal. Specifically, when price makes a new high within the lookback period but closes below the previous candle's high, it's identified as a high liquidity grab; when price makes a new low but closes above the previous candle's low, it's identified as a low liquidity grab.
-
Smart Money Divergence: Compares price movement with the RSI indicator to look for divergence patterns. When price makes a new low but RSI doesn't make a new low, a bullish divergence forms; when price makes a new high but RSI doesn't make a new high, a bearish divergence forms. This divergence typically indicates that the market's internal momentum doesn't align with price movement, suggesting a potential reversal.
-
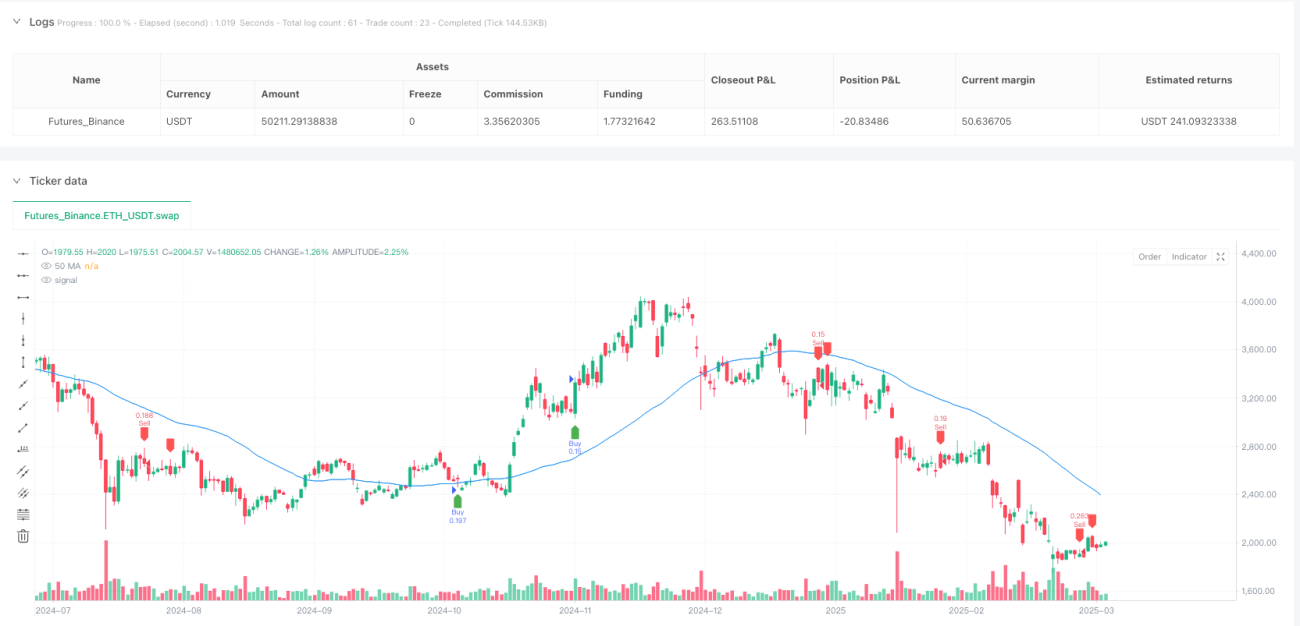
Trend Confirmation Filter: Uses a 50-period Simple Moving Average (SMA) as a trend determination tool, executing trades only when aligned with the trend direction. When price is above the SMA, it's considered an uptrend and only long positions are considered; when price is below the SMA, it's considered a downtrend and only short positions are considered.
-
Dynamic Risk Management: Sets dynamic stop-loss and profit targets based on the ATR (Average True Range) indicator. Stop-loss is set at 1.5 times the current ATR value, and the profit target is set at twice the stop-loss distance (i.e., 3 times the ATR value).
The trade signal generation logic is:
- Long signal: Low liquidity grab identified + RSI bullish divergence confirmed + Price above SMA
- Short signal: High liquidity grab identified + RSI bearish divergence confirmed + Price below SMA
Strategy Advantages
-
High-Probability Reversal Point Identification: By combining liquidity grabs and smart money divergence, the strategy can more accurately capture structural market turning points, reducing the probability of false signals.
-
Trend Filtering Mechanism: With SMA trend confirmation added, the strategy avoids counter-trend trading and only seeks entry opportunities in the direction of the main trend, improving the success rate of trades.
-
Adaptive Risk Management: The ATR-based dynamic stop-loss mechanism allows risk control to adjust automatically according to market volatility, maintaining appropriate risk exposure in different market environments.
-
Optimized Risk-Reward Ratio: The strategy employs a 1:2 risk-reward setting (stop-loss at 1.5x ATR, profit target at 3x ATR), providing a more advantageous mathematical expectation.
-
Multiple Confirmation Mechanism: Trade signals must meet multiple conditions (liquidity grab, divergence signal, trend confirmation), reducing the possibility of erroneous signals and enhancing trading robustness.
-
Adaptation to Market Cycle Changes: Since the strategy can both go long and short, it can adapt to different market cycles and environments, not limited to a single market direction.
Strategy Risks
-
Over-Optimization Risk: The strategy relies on multiple parameters (RSI length, lookback period, moving average period, ATR parameters, etc.), creating the possibility of over-optimization (overfitting), which may lead to good backtest results but poor live trading performance.
-
Signal Lag: Due to the use of moving averages and RSI indicators, some signals may appear with a lag, resulting in untimely entries or missed optimal entry points.
-
Insufficient Liquidity Risk: In low-liquidity market environments, the concept of liquidity grabs may not be as evident, leading to decreased signal quality.
-
Extreme Market Volatility Risk: During periods of abnormal market volatility, ATR may suddenly expand, causing stop-loss positions to be placed too far away and increasing single-trade risk.
-
Poor Performance in Ranging Markets: In sideways, ranging markets with no clear trend, the strategy may produce more false signals, resulting in frequent stop-losses.
-
Parameter Sensitivity: Strategy performance is relatively sensitive to parameter selection, and different markets and timeframes may require different parameter settings.
Strategy Optimization Directions
-
Dynamic Parameter Adjustment: Consider introducing an adaptive parameter mechanism that dynamically adjusts RSI length, lookback period, and MA period based on market volatility and trend strength to adapt to different market environments.
-
Volume Confirmation Addition: Incorporate volume analysis in liquidity grab and divergence judgment to improve signal quality. High-volume liquidity grabs typically hold more significance, indicating more market participants being trapped.
-
Multiple Timeframe Analysis: Introduce a multiple timeframe confirmation mechanism, executing trades only when aligned with higher timeframe trend direction, which can further reduce the probability of false signals.
-
Profit-Taking Mechanism Optimization: Consider implementing partial profit-taking or trailing stop-loss strategies instead of simple fixed-ratio profit-taking to better capture trending market movements.
-
Market Environment Filtering: Introduce volatility indicators (such as ATR ratio or Bollinger Bandwidth) to identify market environments and adjust strategy parameters or pause trading during high volatility or sideways ranging markets.
-
Machine Learning Enhancement: Consider using machine learning methods to optimize parameter selection or signal quality assessment, improving strategy adaptability and robustness.
-
Counter-Logic Mechanism: In extreme market conditions (such as severe RSI overbought/oversold), consider adding reverse signal logic to avoid entering positions when the market is about to reverse.
Summary
The Liquidity Grab & Smart Money Divergence Indicator Combination Strategy is a comprehensive trading system based on market microstructure and technical indicators, capturing high-probability trading opportunities by identifying traces of large capital operations and internal momentum changes. This strategy combines price action analysis, technical indicator divergence, and trend confirmation, supplemented by dynamic risk management, forming a relatively complete trading framework.
The strategy's greatest advantage lies in its ability to capture structural market turning points—critical moments when large institutions may change direction after completing liquidity collection. Through multiple confirmation mechanisms and trend filtering, the strategy reduces the probability of erroneous signals and improves trading quality. However, the strategy also faces challenges related to parameter optimization, false signals, and market adaptability.
To further enhance strategy performance, consider introducing dynamic parameter adjustment, multiple timeframe analysis, volume confirmation, and optimized profit-taking mechanisms. Overall, this strategy provides an effective framework for capturing market turning points and, with proper risk management and continuous optimization, has the potential to become a robust trading system.
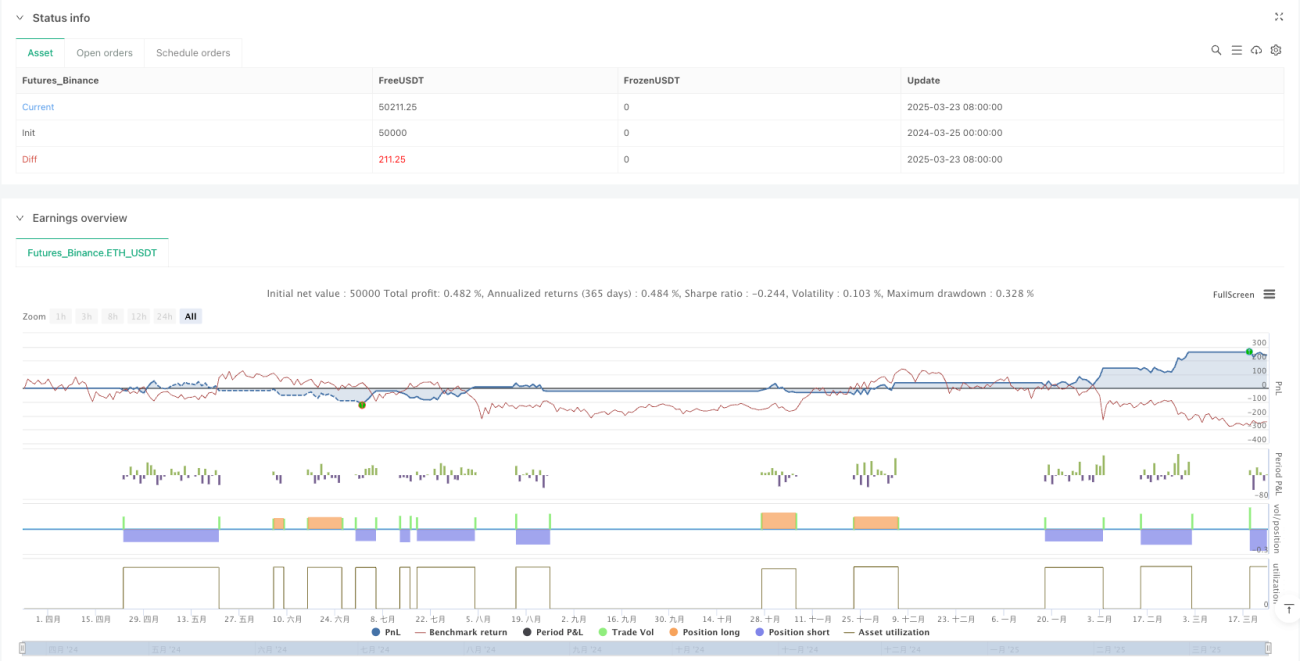
/*backtest
start: 2024-03-25 00:00:00
end: 2025-03-24 00:00:00
period: 1d
basePeriod: 1d
exchanges: [{"eid":"Futures_Binance","currency":"ETH_USDT"}]
*/

//@version=5
strategy("Liquidity Grab + Smart Money Divergence Strategy", overlay=true, default_qty_type=strategy.percent_of_equity, default_qty_value=1)

// Input settings- 1