
Overview
The Multi-Timeframe Exponential Moving Average Crossover Strategy with Trend Confirmation System is a quantitative trading strategy based on technical analysis that primarily utilizes the crossover relationship between two Exponential Moving Averages (EMAs) of different periods and the Average Directional Index (ADX) to identify market trends and generate trading signals. The core concept involves analyzing price crossovers with the 50-period EMA, the relative position between the 50-period EMA and 200-period EMA, and trend strength confirmation using the ADX indicator within specific trading sessions. The strategy also integrates risk management mechanisms through preset take-profit and stop-loss levels to control the risk-to-reward ratio for each trade.
Strategy Principle
The Multi-Timeframe Exponential Moving Average Crossover Strategy with Trend Confirmation System is based on several key components:
-
Exponential Moving Average (EMA) Crossover System: The strategy employs two critical EMAs - a short-term 50-period EMA and a long-term 200-period EMA. When price crosses above the 50-period EMA while the 50-period EMA is above the 200-period EMA, a potential long signal is formed; conversely, when price crosses below the 50-period EMA while the 50-period EMA is below the 200-period EMA, a potential short signal is generated.
-
Average Directional Index (ADX) Trend Confirmation: The strategy uses a 14-period ADX indicator to measure trend strength and compares the Positive Directional Indicator (DI+) and Negative Directional Indicator (DI-) values to confirm trend direction. When the ADX value exceeds the set threshold (default 20), it indicates a sufficiently strong trend, enhancing the reliability of trading signals.
-
Time Filtering: The strategy implements a dual time filtering mechanism, defining specific trading sessions (default 16:30-20:30) while allowing for more precise setting of trading start and end times (hours and minutes). This design allows the strategy to focus on high-activity periods in specific markets, avoiding false signals during times of insufficient volatility or excessive market noise.
-
Risk Management: The strategy incorporates automated risk control mechanisms, setting fixed take-profit levels (default 600 price minimum movements) and stop-loss levels (default 300 price minimum movements) for each trade, equivalent to a 2:1 reward-to-risk ratio. Additionally, the strategy uses the ATR indicator to dynamically calculate label positions, making trade markers more clearly visible on the chart.
-
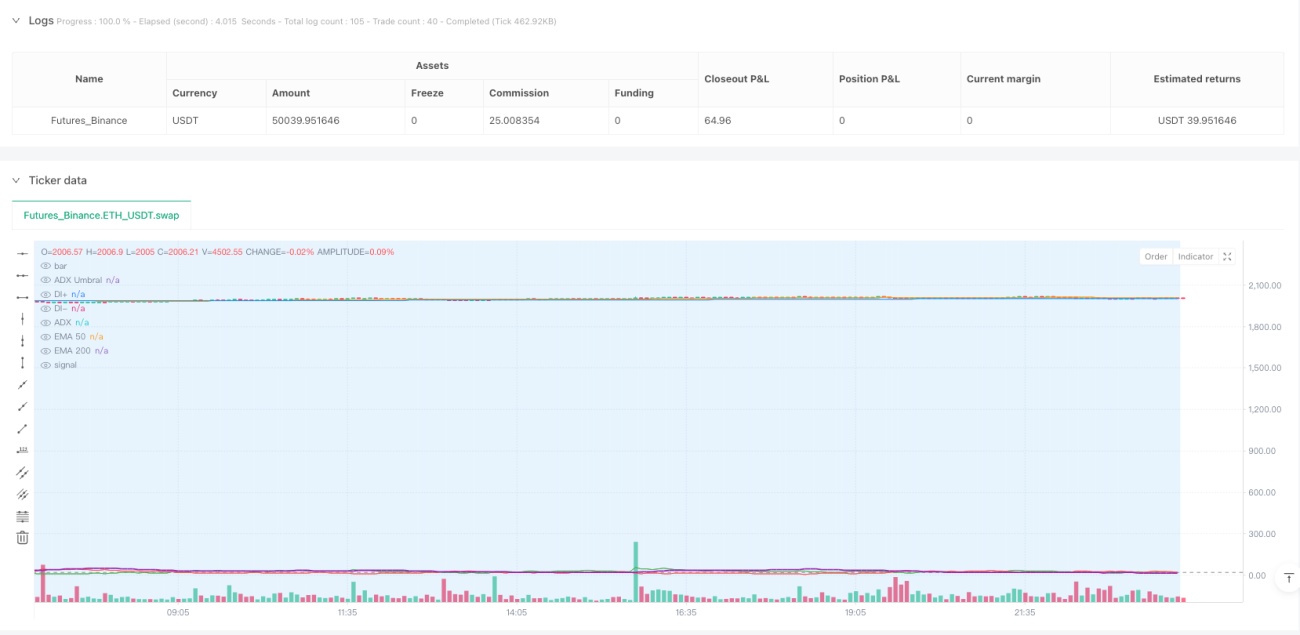
Visual Aids: The strategy plots key technical indicators on the chart, including EMA 200, EMA 50, ADX, and DI+/DI- lines, and uses color coding to mark trading sessions, enhancing the intuitiveness of strategy monitoring and analysis.
Strategy Advantages
The Multi-Timeframe Exponential Moving Average Crossover Strategy with Trend Confirmation System offers several significant advantages:
-
Multiple Confirmation Mechanisms: The strategy relies not only on moving average crossovers but also combines trend direction and strength confirmation, greatly reducing the risk of false breakouts and signals. It requires a triple confirmation of price-EMA crossover, correct EMA relative positioning, and ADX indicator support, significantly improving signal quality.
-
Intelligent Time Filtering: Through precise time period settings, the strategy can be optimized for efficient trading sessions in specific markets, avoiding trading during periods of low liquidity or high volatility uncertainty, thereby improving overall win rate and efficiency.
-
Automated Risk Management: The preset take-profit to stop-loss ratio (2:1) reflects sound risk management principles, ensuring that even in cases of consecutive losses, the strategy can maintain overall profitability through fewer winning trades.
-
Visual Feedback System: The strategy provides clear visual feedback through chart markers and color coding, helping traders monitor strategy execution in real-time and perform backtesting analysis.
-
High Adaptability: While the strategy has default parameters, it offers multiple adjustable input parameters (such as ADX period, smoothing, threshold, and trading session settings), allowing traders to make flexible adjustments based on different market environments and personal risk preferences.
Strategy Risks
Despite its relatively comprehensive design, this strategy still has the following potential risks and limitations:
-
Trend Reversal Delay: Since the strategy is based on moving averages and the ADX indicator, both of which are lagging indicators, it may not capture turning points in a timely manner during rapid market reversals, leading to delayed entries or exits and increasing potential drawdowns.
-
Poor Performance in Ranging Markets: In range-bound markets with no clear trend, moving average crossovers may occur frequently, resulting in multiple false signals and consecutive losses. Although ADX filtering helps mitigate this issue, it cannot completely avoid poor performance in range-bound markets.
-
Limitations of Fixed Take-Profit and Stop-Loss: The strategy uses fixed point settings for take-profit and stop-loss rather than dynamically adjusting based on market volatility (such as ATR multiples), which may lead to stops being too tight or too loose in different volatility environments.
-
Risk of Overfitting in Parameter Optimization: The strategy includes multiple adjustable parameters, including EMA periods, ADX parameters, and trading sessions. Excessive optimization of these parameters may lead to overfitting, where the strategy performs well on historical data but poorly in actual trading.
-
Technical Failure Risk: If the strategy is deployed in an automated trading system, it may face technical failures, network delays, or execution slippage, particularly near the beginning and end of trading sessions.
Strategy Optimization Directions
Addressing the risks and limitations mentioned above, the strategy can be optimized in the following directions:
-
Dynamic Stop-Loss Mechanism: Replace the fixed point stop-loss strategy with an ATR multiple-based dynamic stop-loss, allowing risk management to automatically adapt to changes in market volatility. For example, stop-loss could be set at 1.5 or 2 times the current ATR value, with take-profit at 3 or 4 times the ATR, maintaining a good risk-to-reward ratio.
-
Enhanced Market Environment Filtering: Introduce a market environment classification mechanism, such as using long-term ADX levels or volatility indicators to determine whether the current market is trending or range-bound, then apply different strategy parameters or trading rules based on different market types.
-
Optimized Entry Timing: After meeting basic trading conditions, consider adding short-term price patterns or momentum confirmation, such as waiting for price to form a short-term high/low breakout after crossing the EMA 50, or combining with momentum indicators like RSI for entry optimization.
-
Partial Position Management: Implement mechanisms for partial entry and partial profit-taking, such as entering with only 50% of funds when a signal triggers and adding to the position as the trend develops, or taking profits in stages at different profit levels, increasing strategy flexibility.
-
Integration of Multiple Timeframe Analysis: Building on the current 15-minute timeframe, add trend direction analysis from higher timeframes (such as 1-hour or 4-hour) and only execute trades when trends align across multiple timeframes, further reducing false signals.
-
Optimized Indicator Parameter Adaptation: Develop parameter adaptation mechanisms that allow key EMA and ADX parameters to automatically adjust based on recent market volatility characteristics, improving strategy adaptability across different market environments and avoiding performance degradation from fixed parameters.
Conclusion
The Multi-Timeframe Exponential Moving Average Crossover Strategy with Trend Confirmation System is a comprehensive trading approach combining trend following, indicator confirmation, and time filtering. Through EMA crossover signals, ADX trend confirmation, and strict trading session control, this strategy can capture high-probability trading opportunities in strong trending markets. The built-in risk management mechanism and intuitive visual feedback system further enhance the strategy's practicality and usability.
However, as a trend-following system, this strategy may face challenges in oscillating markets and has limitations related to entry delays and fixed stop-losses. By introducing dynamic risk management, market environment filtering, and multiple timeframe analysis, the strategy's robustness and adaptability across different market conditions can be significantly improved.
For investors pursuing technical analysis and systematic trading, this strategy provides a clearly structured and logically rigorous trading framework capable of generating reliable trading signals under appropriate market conditions while protecting investment capital through built-in risk control mechanisms. Most importantly, the strategy's multiple adjustable parameters allow traders to customize according to their risk preferences and target market characteristics, achieving long-term stable trading performance.
- 1