
Overview
The Multi-Indicator Consensus Trading Strategy is a quantitative trading system that combines three distinct technical indicators, using cross-validation between indicators to confirm trading signals. This strategy integrates Liquidity Weighted Supertrend (LWST), Trend Signal System, and Enhanced Wavetrend Oscillator (WT), executing buy or sell operations only when at least two indicators provide signals in the same direction. This consensus mechanism significantly improves signal reliability and reduces losses from false breakouts. Additionally, the strategy incorporates built-in stop-loss and take-profit mechanisms, providing a risk control framework for each trade.
Strategy Principles
The core principle of the Multi-Indicator Consensus Trading Strategy lies in analyzing market conditions from multiple dimensions to confirm trading direction:
-
Liquidity Weighted Supertrend (LWST): Combines ATR and volume information to create dynamic support and resistance bands. This indicator merges the traditional Supertrend indicator with volume weighting, making the bandwidth more sensitive in high-volume areas. The calculation process includes:
- Calculating volume SMA and generating volume weight ratio
- Computing upper and lower bands based on ATR and volume weight
- Determining trend direction through the relationship between price and trend lines
-
Trend Signal System: Uses a dual EMA system to detect price trends. By comparing the percentage difference between fast and slow moving averages, it judges market trend strength. When the fast EMA exceeds the slow EMA by the set threshold, a bullish signal is generated; conversely, a bearish signal is produced.
-
Enhanced Wavetrend Oscillator (WT): Calculates oscillation values based on the deviation of price from its smoothed average to identify overbought and oversold conditions. This indicator generates signals through the following steps:
- Calculating typical price (HLC3) and applying EMA smoothing
- Computing price volatility and standardizing to generate oscillator values
- Applying two lines with different smoothing degrees to identify crossing points and extreme areas
-
Consensus Signal Mechanism: The strategy executes trades only when at least two indicators reach consensus. This is achieved by calculating the number of bullish indicators (range from -3 to 3), generating a buy signal when the value is greater than or equal to 2, and a sell signal when less than or equal to -2.
-
Risk Management: Each trade sets stop-loss (default 2%) and take-profit (default 4%) levels based on entry price, automatically exiting when either condition is met.
Strategy Advantages
-
Enhanced Signal Filtering: Requiring consensus among multiple indicators before executing trades significantly reduces misleading signals that might be generated by a single indicator, improving trading accuracy.
-
Adaptation to Different Market Conditions: The three indicators focus on different market attributes (trend, momentum, volatility), enabling the strategy to maintain effectiveness in various market environments.
-
Liquidity-Sensitive Adjustment: The Liquidity Weighted Supertrend dynamically adjusts sensitivity according to volume, allowing the strategy to capture trend changes more quickly in high-liquidity areas while remaining more conservative in low-liquidity areas.
-
Built-in Risk Management: Preset stop-loss and take-profit mechanisms provide a clear risk-reward ratio for each trade, keeping single-trade risk within an acceptable range.
-
Intuitive Visualization Tools: The strategy provides real-time signal tables and graphical markers, helping traders quickly grasp current market conditions and indicator signals.
-
Integrated Capital Management: By setting position sizes based on account equity, intelligent capital management is achieved, avoiding excessive risk exposure.
Strategy Risks
-
Parameter Sensitivity: The strategy uses multiple adjustable parameters; inappropriate parameter settings may lead to over-optimization or insufficient signals. Solution: Conduct comprehensive parameter sensitivity analysis and select parameter combinations that perform stably under multiple market conditions.
-
Signal Delay: Due to the use of moving averages and multi-indicator confirmation, the strategy may miss part of the initial trend. Solution: Consider setting different parameter combinations for different time periods, or add a more sensitive short-term indicator.
-
Poor Performance in Ranging Markets: In markets without clear trends, multiple trend indicators may give mixed signals, leading to frequent trading or no trading. Solution: Add a filter specifically designed to identify ranging markets, pausing trading when ranging is detected or switching to a strategy designed for ranging markets.
-
Fixed Stop-Loss Risk: Using fixed percentage stop-losses may not adapt to the volatility characteristics of different assets. Solution: Dynamically adjust stop-loss distances based on ATR or historical volatility.
-
Capital Management Risk: Using 100% of account funds by default may lead to excessive risk concentration. Solution: Dynamically adjust position size based on market conditions and signal strength, implementing diversified trading strategies.
Strategy Optimization Directions
-
Dynamic Parameter Adjustment:
- Implement parameter self-adaptive mechanisms based on market volatility, such as increasing the ATR multiplier during high volatility
- Rationale: Different market environments require different parameter sensitivities; self-adaptive parameters can improve strategy universality
-
Add Market Environment Filters:
- Add mechanisms to identify market states (trending, ranging, high volatility)
- Adjust trading frequency or pause trading in different market environments
- Rationale: Not all market conditions are suitable for trading; selective trading can improve overall win rate
-
Optimize Take-Profit/Stop-Loss Mechanisms:
- Implement dynamic take-profit targets based on support/resistance levels
- Design trailing stops to protect profits
- Rationale: Fixed percentage take-profits/stop-losses cannot fully utilize market structure characteristics
-
Signal Strength Grading:
- Design position sizing adjustment mechanisms based on indicator consensus degree and signal strength
- Use maximum position when all three indicators agree, smaller position when only two agree
- Rationale: Signal strength correlates with trade success probability and should be reflected in position management
-
Time Filters:
- Add time filters to avoid important economic data releases or market open/close volatility
- Rationale: Market fluctuations during specific time periods may not follow technical analysis principles; avoiding these times can reduce noise
Summary
The Multi-Indicator Consensus Trading Strategy creates a robust trading system by integrating Liquidity Weighted Supertrend, Trend Signal System, and Enhanced Wavetrend Oscillator. Its core advantage lies in the multi-indicator consensus mechanism, which significantly improves signal reliability, while the liquidity-weighted component adds sensitivity to market depth. The built-in risk management framework ensures each trade has a predefined risk-reward ratio.
Nevertheless, there is room for optimization, particularly in parameter adaptability, market state identification, and dynamic stop-loss/take-profit. By implementing the suggested optimization directions, especially establishing market environment filters and signal strength grading systems, the strategy can further improve its adaptability and stability under various market conditions.
Overall, this is a well-designed quantitative trading system suitable for experienced traders to backtest and optimize parameters before live trading. The modular design also makes it easy to modify and extend according to individual needs.
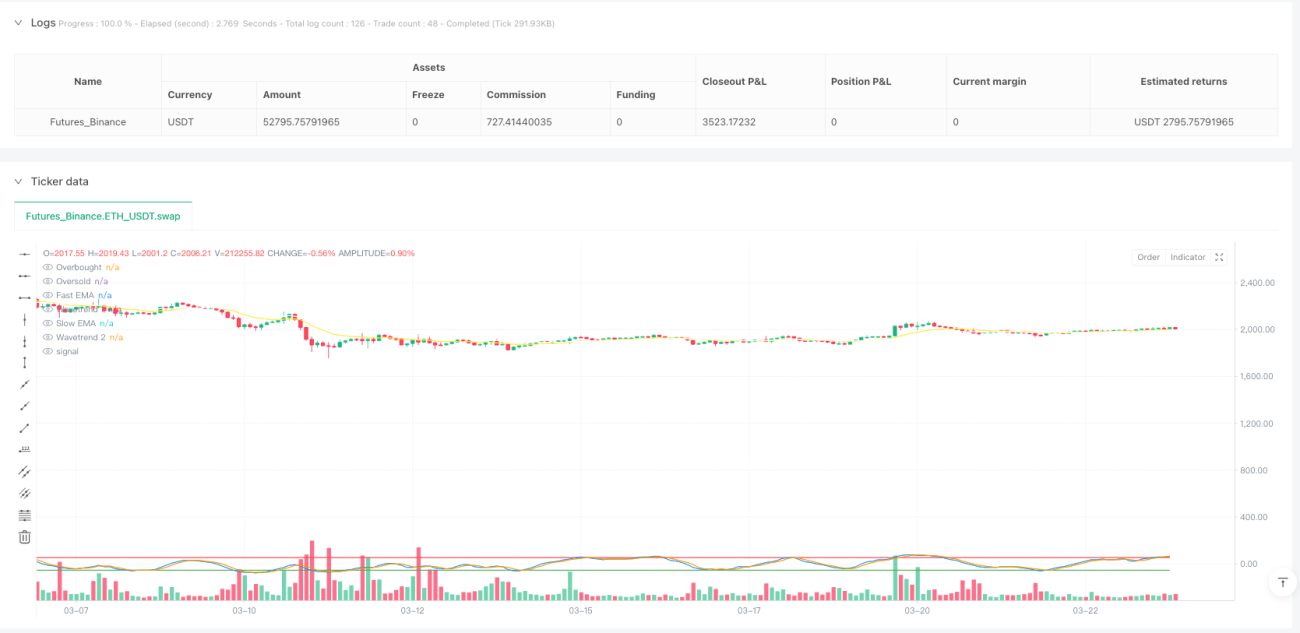
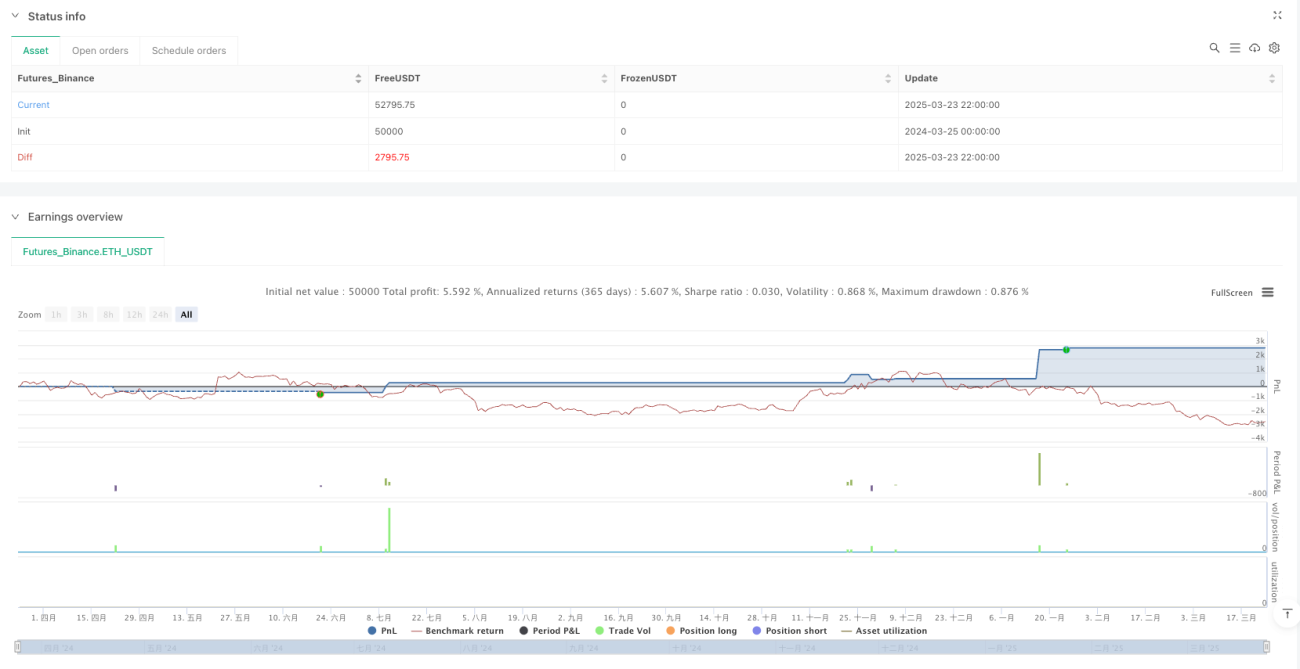
/*backtest
start: 2024-03-25 00:00:00
end: 2025-03-24 00:00:00
period: 2h
basePeriod: 2h
exchanges: [{"eid":"Futures_Binance","currency":"ETH_USDT"}]
*/

//@version=5
strategy("Multi-Indicator Consensus Strategy", overlay=true, initial_capital=100000, default_qty_type=strategy.percent_of_equity, default_qty_value=100)

// =================== Input Parameters ===================- 1