
Overview
The Cross-Breakout Dual EMA System Strategy is a technical analysis approach based on the 32-period Exponential Moving Average (EMA) of highs and lows. The core concept involves identifying price crossovers with the 32-period EMA and special "no-touch candle" formations to confirm trend direction, entering trades after key price breakout confirmations. Specifically designed for the 5-minute timeframe, this strategy employs strict entry conditions and clear exit rules, enabling traders to capture opportunities from short-term trend changes.
Strategy Principles
The strategy operates based on the following key steps:
- Calculate the 32-period EMA of highs (ema_high_32) and lows (ema_low_32) as primary reference lines.
- Identify critical price-EMA crossovers: When closing price crosses above the high EMA, mark potential long opportunities; when closing price crosses below the low EMA, mark potential short opportunities.
- Look for "no-touch candle" formations: For long positions, identify bullish candles completely above the high EMA; for short positions, identify bearish candles completely below the low EMA.
- Record the high or low of the first "no-touch candle" as a breakout reference point.
- When price breaks through this reference point and the next candle in the same direction appears, trigger an entry signal.
- Exit strategy: Close long positions when price closes below the low EMA; close short positions when price closes above the high EMA.
The core logic of this strategy lies in requiring not only price-EMA crossovers but also "no-touch candle" and breakout confirmation to filter false signals, improving trading accuracy. This multi-confirmation mechanism effectively reduces the risk of incorrect entries in ranging markets.
Strategy Advantages
Through in-depth code analysis, this strategy demonstrates the following significant advantages:
- Dual confirmation mechanism: The strategy requires not only price-EMA crossovers but also "no-touch candle" and price breakout confirmations, greatly reducing the risk of false breakouts.
- Balances trend-following and reversal: While primarily a trend-following strategy, it can promptly identify potential trend reversals by capturing EMA crossover points.
- Clear entry and exit rules: The strategy has strictly defined entry and exit conditions, reducing subjective judgment and facilitating algorithmic implementation and backtesting.
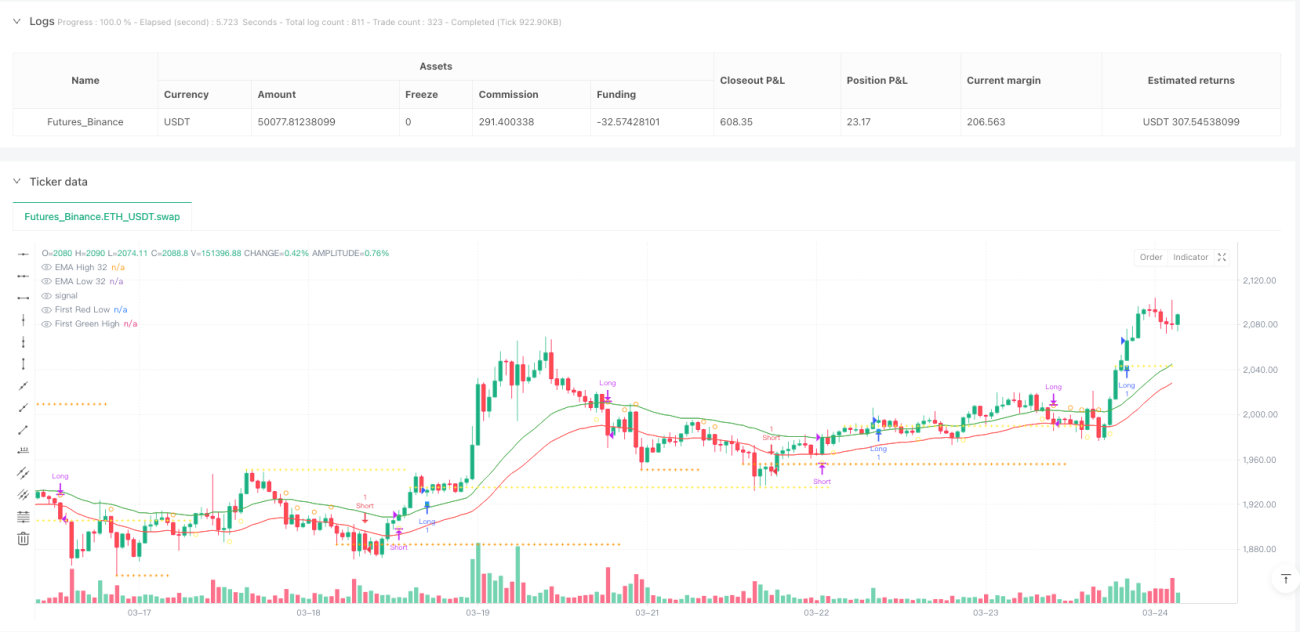
- Rich visual assistance: The strategy provides various visual indicators on charts, including EMA lines, breakout points, and trade signal markers, helping traders intuitively understand market conditions.
- Comprehensive state management: Multiple boolean variables in the code strictly track trading states, ensuring no duplicate entries or confusing signals occur.
- Adaptation to short-term fluctuations: Specifically designed for the 5-minute timeframe, effectively capturing trading opportunities from short-term market movements.
Strategy Risks
Despite its sophisticated design, the strategy still presents the following potential risks:
- Consolidation risk: In oscillating markets where prices frequently cross EMAs, it may lead to frequent trading and consecutive losses. Solution: Add additional market environment filtering conditions, such as volatility indicators or trend strength indicators.
- Parameter sensitivity: The 32-period EMA parameter is central to the strategy; different markets or timeframes may require different parameter settings. Recommendation: Optimize through backtesting to determine parameters best suited for specific trading instruments.
- Delay risk: Due to multiple confirmation requirements, entry delays may occur during rapid trend changes, missing partial price movements. Consider relaxing entry conditions in strong trend environments.
- False breakout risk: Despite multiple confirmations, markets may still show false breakouts followed by quick retracements. Consider adding stop-loss strategies or using more conservative position management.
- Timeframe limitation: The strategy is specifically designed for the 5-minute framework; direct application to other timeframes may yield suboptimal results. Parameters need re-optimization when applied to other timeframes.
- Lack of profit-taking mechanism: The current strategy has stop-losses but no clear profit-taking rules, potentially leading to premature exits before trend completion or missed profits. Recommend adding dynamic profit-taking mechanisms based on volatility or support/resistance.
Strategy Optimization Directions
Based on code analysis, here are several main directions for strategy optimization:
- Dynamic EMA periods: Consider dynamically adjusting EMA periods based on market volatility, using shorter EMAs in high-volatility markets and longer EMAs in low-volatility markets, adapting to different market environments.
- Add trend strength filtering: Incorporate trend strength indicators like ADX, only entering positions when trend strength is sufficient, avoiding frequent trading in ranging markets.
- Optimize profit-taking strategy: Add dynamic profit-taking mechanisms based on ATR or key price levels, protecting profits when trends develop favorably.
- Time filtering: Add time filtering conditions to avoid trading during market opening, closing, or low-liquidity sessions.
- Multi-timeframe analysis: Integrate higher timeframe trend directions as filtering conditions, only trading when multi-timeframe trends align.
- Position management optimization: Dynamically adjust position sizes based on market volatility or account risk proportions, rather than fixed positions.
- Add trade duration limits: Automatically close positions if trades don't reach expected returns within a certain timeframe, avoiding long-term trapped positions.
These optimization directions primarily aim to enhance strategy robustness and adaptability, reducing losses in unfavorable market environments.
Summary
The Cross-Breakout Dual EMA System Strategy is a meticulously designed technical analysis trading system that identifies high-probability trading opportunities through multiple mechanisms including 32-period EMA highs and lows, price crossovers, no-touch candles, and breakout confirmations. This strategy performs excellently in markets with clear trends, effectively reducing false entry risks through strict entry confirmations and clear exit rules.
However, like any trading strategy, it has limitations and may face challenges in ranging or highly volatile markets. By introducing trend strength filtering, dynamic parameter adjustments, multi-timeframe analysis, and other optimization measures, the strategy's stability and adaptability can be further enhanced.
As a short-term trading system for the 5-minute timeframe, this strategy is particularly suitable for intraday and short-term traders. Finally, good risk management remains key to successfully applying any trading strategy. Traders are advised to conduct thorough backtesting and simulated trading before live implementation, developing reasonable position management rules based on individual risk tolerance.
- 1