
Overview
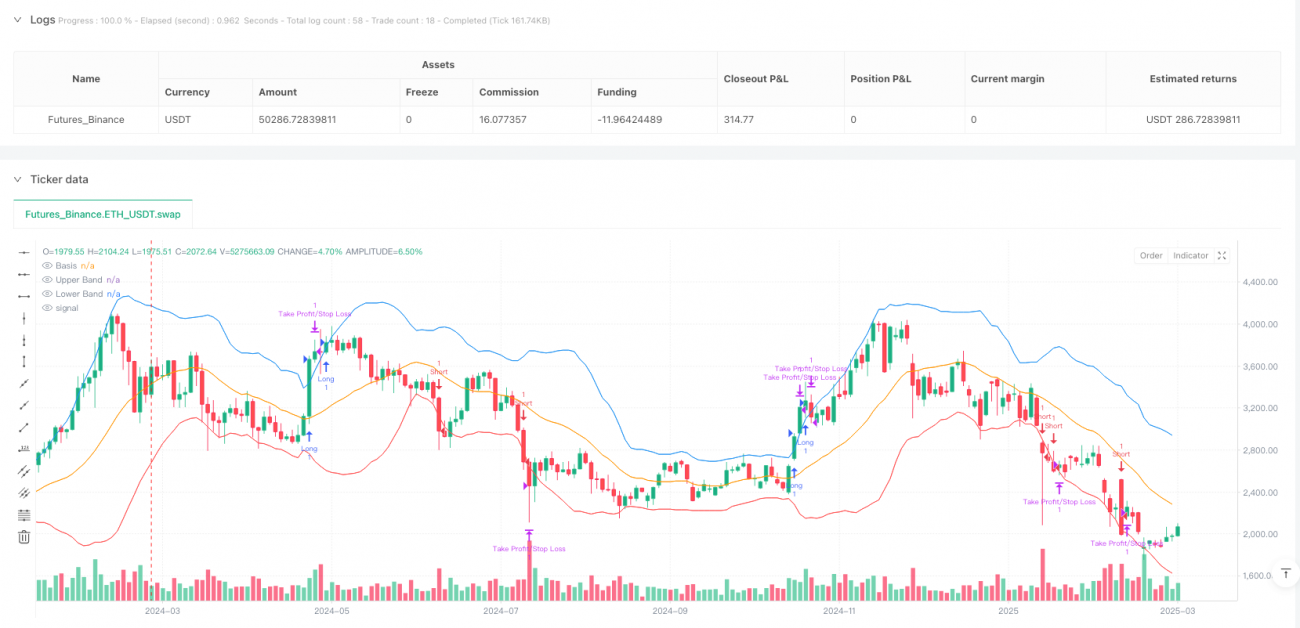
The Dynamic Breakout Bollinger Bands Trading System is a quantitative trading strategy based on the technical analysis indicator Bollinger Bands. The core concept of this strategy is to identify overbought and oversold market conditions by capturing price breakouts beyond the Bollinger Bands, and entering the market at appropriate timing. The system uses a 20-period Simple Moving Average as the basis line, with a standard deviation multiplier of 2.0 to calculate the upper and lower bands, complemented by a 1% stop loss and 2% take profit setup to control risk and secure profits.
Strategy Principles
The core principle of this strategy is based on Bollinger Bands theory, which suggests that prices typically fluctuate within the bands, and a breakout beyond the upper or lower bands may indicate overbought or oversold conditions with potential price reversals. Specifically:
-
Bollinger Bands Calculation: Uses a 20-period Simple Moving Average (SMA) as the middle band (basis line), the upper band is the middle band plus 2 times the standard deviation, and the lower band is the middle band minus 2 times the standard deviation.
-
Short Entry Condition: When a red candle (closing price lower than opening price) closes below the lower band, a short position is entered at the opening price of the next candle.
-
Long Entry Condition: When a green candle (closing price higher than opening price) closes above the upper band, a long position is entered at the opening price of the next candle.
-
Risk Management: For long positions, stop loss is set at 1% below the entry price with take profit at 2% above; for short positions, stop loss is set at 1% above the entry price with take profit at 2% below.
The system enhances signal reliability and reduces false signals by waiting for confirmatory breakouts (red/green candle validation) and entering at the opening of the subsequent candle.
Strategy Advantages
-
High Signal Reliability: The strategy effectively filters out some false breakout signals by requiring candle color consistency with breakout direction (green candles for long entries, red candles for short entries) and entering at the opening of the next candle.
-
Reasonable Risk-Reward Ratio: The strategy establishes a 1% stop loss and 2% take profit, creating a risk-reward ratio of 1:2, which adheres to sound money management principles.
-
Strong Parameter Adaptability: Parameters such as Bollinger Band length, standard deviation multiplier, stop loss percentage, and take profit percentage can all be adjusted according to different market characteristics and trader risk preferences.
-
Visual Intuitiveness: The strategy plots the middle, upper, and lower Bollinger Bands directly on the chart, allowing traders to visually observe the relationship between price and the bands for easier understanding and judgment.
-
High Adaptability: Bollinger Bands automatically adjust their width according to market volatility, widening in high-volatility markets and narrowing in low-volatility markets, enabling the strategy to adapt to different market environments.
Strategy Risks
-
Sideways Market Risk: In consolidation or choppy markets, prices may frequently touch the upper and lower Bollinger Bands without forming a genuine trend, leading to frequent trades and consecutive stop losses.
-
Extreme Volatility Risk: During major news releases or black swan events, markets may experience gaps or extreme volatility, potentially causing stop loss failures or significant slippage.
-
Parameter Sensitivity: The choice of Bollinger Band length and standard deviation multiplier directly affects the frequency and accuracy of signal generation; inappropriate parameter settings may result in overtrading or missed significant opportunities.
-
Fixed Stop Loss/Take Profit Risk: Using fixed percentage-based stop loss and take profit methods may not be suitable for all market environments, especially in markets with significantly changing volatility.
-
Delayed Entry Issue: The strategy enters at the opening of the next candle after confirming a breakout, potentially missing part of the price movement and reducing profit potential.
To address these risks, traders are advised to:
- Combine other technical indicators or market structure analysis to confirm signals
- Dynamically adjust parameter settings in different market environments
- Consider using volatility-adjusted stop loss and take profit mechanisms
- Pause strategy operation before major economic data releases
Strategy Optimization Directions
-
Introduce Trend Filters: Add long-term moving averages or MACD as trend indicators to ensure trading only in the direction of the main trend, avoiding frequent trading in choppy markets. This can be implemented by only executing long signals when price is above a long-term moving average, and vice versa.
-
Optimize Bollinger Band Parameters: Experiment with dynamically adjusting the Bollinger Band length and standard deviation multiplier, such as self-adapting parameters based on recent market volatility, enabling the strategy to better adapt to different market environments.
-
Improve Stop Loss/Take Profit Mechanism: Consider setting stop loss and take profit based on ATR (Average True Range) rather than fixed percentages to better adapt to market volatility changes. This provides wider stops in highly volatile market environments and tighter stops in less volatile markets.
-
Add Volume Confirmation: Incorporate volume indicators to confirm breakout validity, such as requiring significant volume increase during breakouts to enhance signal reliability.
-
Optimize Entry Timing: Consider entering immediately after breakout confirmation rather than waiting for the next candle's opening, or design more complex entry logic, such as waiting for a retest of the Bollinger Band before entering, to obtain better entry prices.
-
Introduce Time Filters: Based on market characteristics during different time periods, enable the strategy during specific high-efficiency trading sessions while avoiding periods of insufficient liquidity or excessive volatility.
-
Money Management Optimization: Implement dynamic position sizing mechanisms to adjust position size for each trade based on market conditions and account equity for better risk control.
Summary
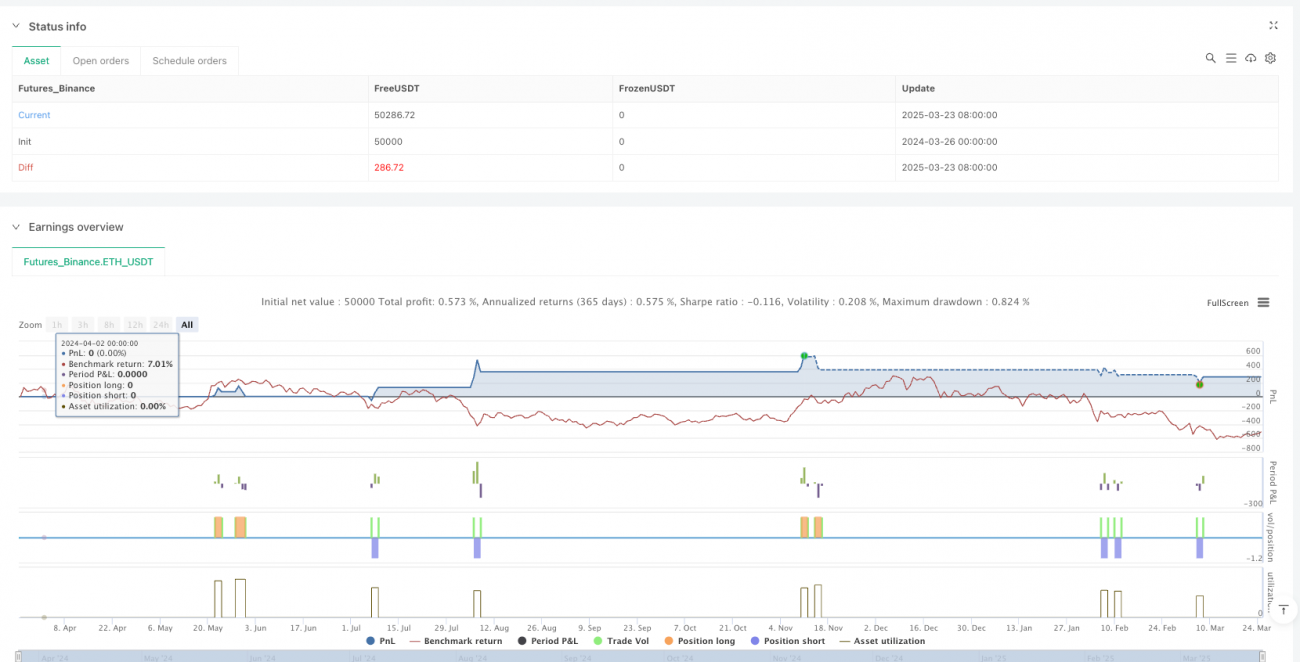
The Dynamic Breakout Bollinger Bands Trading System is a quantitative trading strategy based on the relationship between price and Bollinger Bands, executing trades by capturing price breakouts beyond the upper and lower bands. The strategy design is concise and operational rules are clear, making it suitable as a basic framework for volatility breakout trading systems. The core advantages lie in its adaptability to price volatility and clear risk control mechanisms, though it may face issues with frequent trading and false signals in choppy markets.
By introducing trend filters, optimizing parameter settings, improving stop loss and take profit mechanisms, and adding volume confirmation, the stability and profitability of the strategy can be significantly enhanced. For traders, it's recommended to conduct thorough backtesting and parameter optimization before live implementation, making appropriate adjustments based on market environment and personal risk preferences. Ultimately, successful trading depends not only on the strategy itself but also on the trader's understanding of the market and strict disciplinary execution.
- 1