
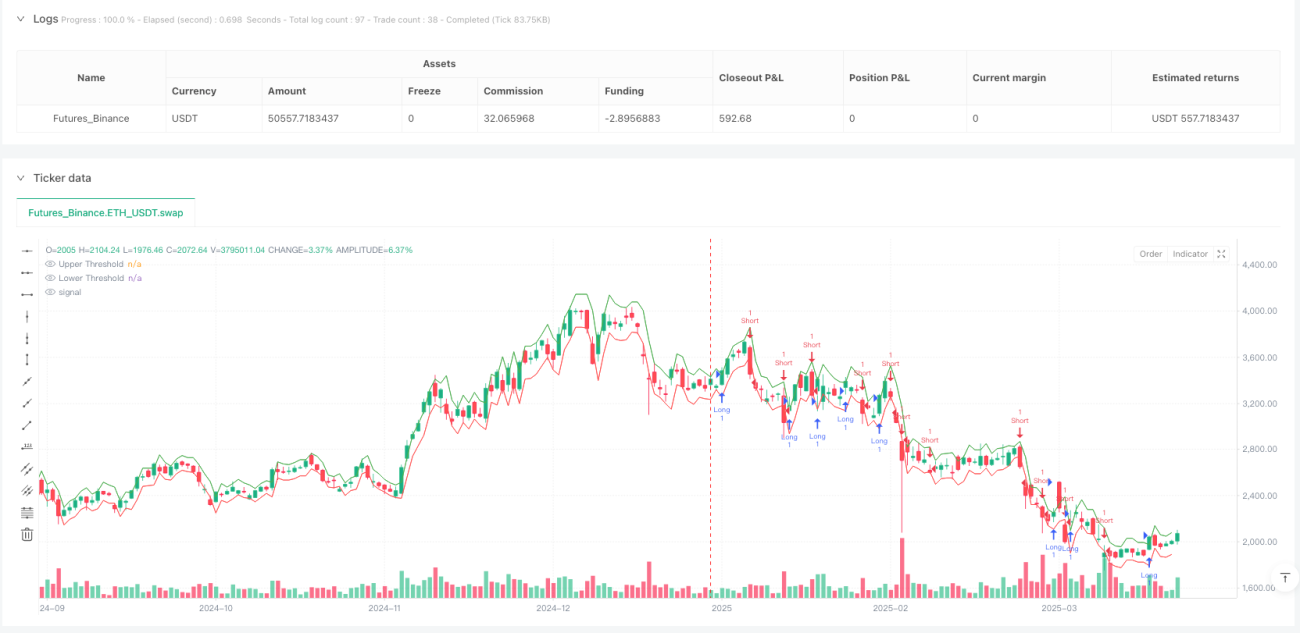
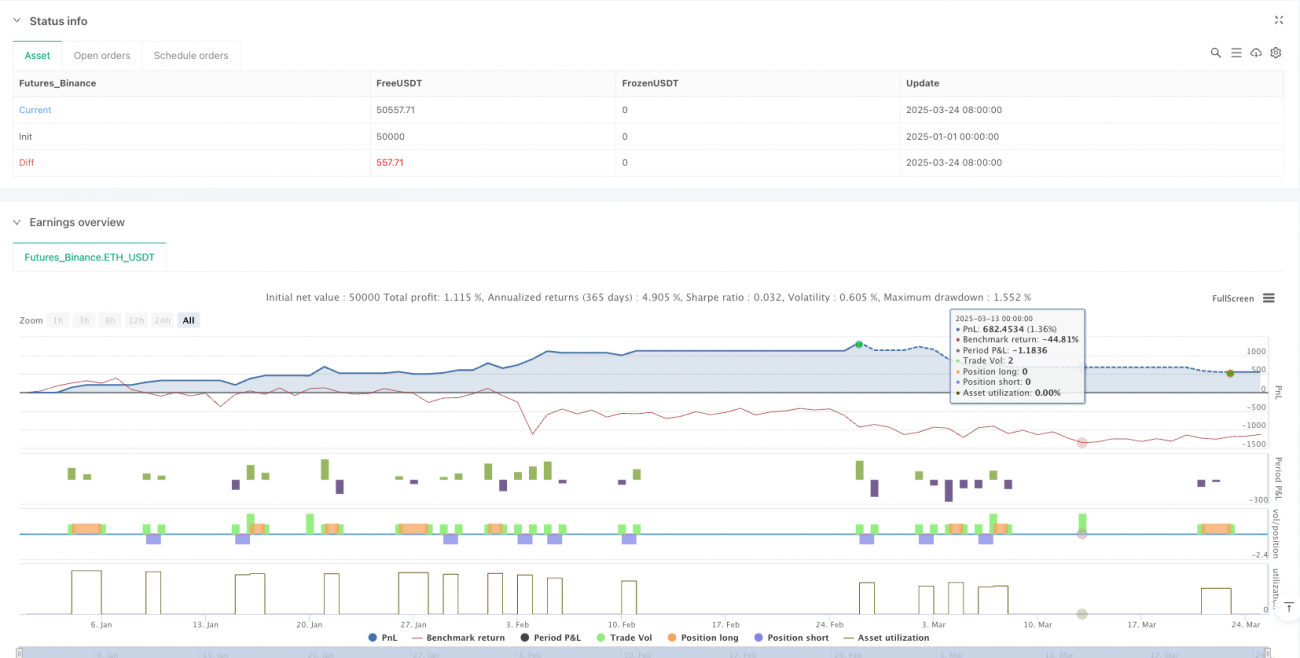
Overview
The Black-Scholes Volatility Adjusted Dynamic Breakout Strategy is a quantitative trading approach based on statistical principles and option pricing theory. This strategy cleverly applies concepts from the Black-Scholes model to market price breakout analysis, calculating historical volatility and dynamically adjusting expected price ranges to intelligently capture breakout signals. The core of the strategy lies in using the standard deviation of logarithmic returns to estimate market volatility and transform it into expected price movement for each trading period, thereby establishing dynamic upper and lower thresholds. When prices break through these thresholds, corresponding buy or sell signals are triggered. Additionally, the strategy incorporates built-in stop-loss and take-profit mechanisms to ensure effective risk control.
Strategy Principles
The operating principles of this strategy are based on the following steps:
-
Volatility Calculation: First, logarithmic returns are calculated (logReturn = math.log(close / close[1])), then the standard deviation of these log returns is computed using a specified lookback period (default 20 periods) and annualized (multiplied by the square root of trading periods, considering 252 trading days per year with 390 minutes per day).
-
Expected Move Calculation: Using a Black-Scholes inspired approach, the expected price movement for each trading period is calculated (expectedMove = close[1] * volatility * math.sqrt(1 / periodsPerYear)). This effectively converts annualized volatility into an expected movement magnitude for a single period.
-
Dynamic Threshold Setting: Based on the previous closing price and the calculated expected movement, upper and lower thresholds are established (upperThreshold = close[1] + expectedMove and lowerThreshold = close[1] - expectedMove).
-
Trading Signal Generation: When the current closing price breaks above the upper threshold, a long signal is triggered; when it breaks below the lower threshold, a short signal is triggered.
-
Risk Management: The strategy automatically sets percentage-based stop-loss (default 1%) and take-profit (default 2%) orders after entering a trade. For long positions, the stop-loss is set below the entry price by the specified percentage, and the take-profit above by the specified percentage; for short positions, the opposite applies.
Advantage Analysis
-
Dynamic Adaptability: Compared to traditional breakout strategies using fixed prices or percentages, this strategy dynamically adjusts breakout thresholds based on actual market volatility, better adapting to different market conditions and volatility environments.
-
Statistical Foundation: The strategy is based on established statistical principles and option pricing theory, using logarithmic returns and standard deviation calculations, providing a solid theoretical foundation.
-
Automated Risk Management: Built-in stop-loss and take-profit mechanisms ensure that each trade has preset risk control measures, avoiding excessive position holding or expanded losses due to emotional factors.
-
Parameter Flexibility: Users can adjust volatility lookback periods, stop-loss, and take-profit percentages according to different markets and personal risk preferences, giving the strategy high adaptability.
-
Computational Efficiency: The strategy calculations are relatively simple and direct, without requiring complex indicator combinations, reducing the risk of overfitting and improving execution efficiency.
Risk Analysis
-
False Breakout Risk: Markets may exhibit brief threshold breakouts followed by quick retracements, leading to false signals and unnecessary trading costs. This risk can be reduced by adding confirmation mechanisms (such as requiring sustained breakouts or volume confirmation).
-
Volatility Estimation Errors: Historical volatility may not accurately predict future volatility, especially during rapidly changing market conditions. Consider incorporating implied volatility or using more complex volatility models like GARCH to improve prediction accuracy.
-
Parameter Sensitivity: Strategy performance may be sensitive to volatility lookback periods, stop-loss, and take-profit settings. Extensive backtesting and parameter optimization are recommended to find the optimal parameter combination for specific markets.
-
Trend Market Performance: In strong trending markets, prices may continue moving in one direction beyond the expected volatility range, causing missed opportunities in important trends. Consider supplementing the strategy with trend indicators.
-
Trading Cost Impact: Frequent breakout signals may lead to excessive trading, increasing commission and slippage costs. Setting trade intervals or signal filters can reduce trading frequency.
Optimization Directions
- Volatility Calculation Improvements: Explore using Exponentially Weighted Moving Average (EWMA) or GARCH models to calculate volatility, which better capture volatility clustering effects and time-varying characteristics. Improved code might look like:
// EWMA volatility calculation
alpha = 0.94 // decay factor
ewmaVar = 0.0
ewmaVar := alpha * ewmaVar[1] + (1 - alpha) * logReturn * logReturn
ewmaVol = math.sqrt(ewmaVar) * math.sqrt(periodsPerYear)
- Signal Confirmation Mechanism: Add volume confirmation or price momentum confirmation to reduce false breakout risks:
            volumeConfirmation = volume > ta.sma(volume, 20) * 1.5
momentumConfirmation = ta.rsi(close, 14) > 50 for longCondition or < 50 for shortCondition
longCondition := longCondition and volumeConfirmation and momentumConfirmation
- Adaptive Stop-Loss Mechanism: Set dynamic stop-losses based on ATR (Average True Range) to better adapt to market volatility:
            atrPeriod = 14
atrMultiplier = 2
atrValue = ta.atr(atrPeriod)
dynamicStopLoss = atrMultiplier * atrValue
- Time Filtering: Add trading time filters to avoid abnormally volatile market opening and closing periods:
            timeFilter = (hour >= 10 and hour < 15) or (hour == 15 and minute < 30)
longCondition := longCondition and timeFilter
- Multi-timeframe Confirmation: Filter signals that contradict the main trend by checking higher timeframe directions:
            higherTimeframeClose = request.security(syminfo.tickerid, "60", close)
higherTimeframeTrend = ta.ema(higherTimeframeClose, 20) > ta.ema(higherTimeframeClose, 50)
longCondition := longCondition and higherTimeframeTrend
shortCondition := shortCondition and not higherTimeframeTrend
Summary
The Black-Scholes Volatility Adjusted Dynamic Breakout Strategy is an innovative quantitative approach that merges option pricing theory with traditional breakout trading methods. By calculating market volatility and converting it into expected price movement ranges, it establishes dynamic trading thresholds that effectively adapt to volatility characteristics under different market conditions. The strategy's core strengths lie in its statistical foundation, dynamic adaptability, and built-in risk management mechanisms, giving it potential advantages in changing market environments.
However, the strategy also faces challenges such as false breakouts, volatility estimation errors, and parameter sensitivity. By introducing improvements in volatility calculation, signal confirmation mechanisms, dynamic risk management, and multi-timeframe analysis, the strategy's stability and reliability can be significantly enhanced. These optimizations will particularly help the strategy better identify effective signals and control risk in highly volatile or rapidly changing market environments.
Overall, the Black-Scholes Volatility Adjusted Dynamic Breakout Strategy represents an effective attempt to combine traditional technical analysis with modern financial theory, providing quantitative traders with a trading framework that has a solid theoretical foundation, strong flexibility, and ease of implementation. With continuous optimization and appropriate adjustments, this strategy has the potential to achieve robust performance under various market conditions.
/*backtest
start: 2025-01-01 00:00:00
end: 2025-03-25 00:00:00
period: 1d
basePeriod: 1d
exchanges: [{"eid":"Futures_Binance","currency":"ETH_USDT"}]
*/

//@version=5
strategy("black-scholes expected breakoout", overlay=true, initial_capital=100000, currency=currency.USD, calc_on_order_fills=true, calc_on_every_tick=true)

// User Inputs- 1