
Overview
The Multi-Indicator Dynamic Volatility Breakout Strategy is a comprehensive trading approach that combines multiple technical indicators and candlestick patterns to capture market trend reversal points. This strategy primarily utilizes Exponential Moving Averages (EMA) to confirm trend direction, Relative Strength Index (RSI) to identify overbought and oversold zones, Average True Range (ATR) to dynamically calculate stop-loss and take-profit levels, and incorporates various reversal candlestick patterns as confirmation signals. This multi-layered signal confirmation mechanism effectively filters out false breakout signals and improves trading success rates.
Strategy Principles
The core principle of this strategy is based on aggregated analysis of multiple conditions, forming a complete trading system:
-
Trend Confirmation: Using short-term EMA (50 periods) and long-term EMA (200 periods) to determine market trends. Prices must break above the short-term EMA and be above the long-term EMA for long positions; conversely, prices must break below the short-term EMA and be below the long-term EMA for short positions. This ensures that trading direction aligns with the primary trend.
-
Momentum Analysis: Utilizing the RSI indicator (14 periods) to evaluate market momentum. Long conditions require RSI below 45 or in oversold territory (RSI<30); short conditions require RSI above 55 or in overbought territory (RSI>70). This helps to trade in areas where trends may be reversing.
-
Candlestick Pattern Confirmation:
- Long signals require hammer or morning star patterns
- Short signals require shooting star or evening star patterns
These candlestick patterns are visual representations of market psychology shifts, enhancing signal reliability.
-
Risk Management: Using ATR (14 periods) to calculate dynamic stop-loss and take-profit levels:
- Long stop-loss: Current price - (ATR × 1.5)
- Long take-profit: Current price + (ATR × 2.0 × 2)
- Short stop-loss: Current price + (ATR × 1.5)
- Short take-profit: Current price - (ATR × 2.0 × 2)
This stop-loss design considers market volatility, while the take-profit ratio is more than twice the stop-loss, establishing an ideal risk-reward ratio.
Strategy Advantages
-
Multi-layered Signal Filtering: Combining multiple technical indicators and candlestick patterns significantly reduces the risk of false signals. Trading signals are only generated when trend, momentum, and pattern all confirm together, improving the strategy's precision.
-
Adaptive Risk Management: The ATR-based dynamic stop-loss and take-profit mechanism automatically adjusts according to market volatility, setting wider protection ranges in volatile market environments and more precise ones in stable markets.
-
Flexible Timeframes: The strategy can be applied to all time periods, from intraday trading to long-term investment, providing options for investors with different trading styles.
-
Clear Entry and Exit Rules: The strategy provides objective entry and exit conditions, reducing subjective judgment and helping traders maintain discipline and consistency.
-
Integrated Capital Management: The strategy defaults to using 20% of account equity for each trade, a proportion that helps with long-term capital growth and risk diversification.
Strategy Risks
-
False Breakout Risk: Despite multiple filtering conditions, false breakouts may still occur in oscillating markets. Solution: Consider adding confirmation periods or adjusting RSI parameters in high-volatility environments.
-
Trend Reversal Lag: Using EMA as a trend confirmation tool may lead to some lag when trends reverse. Solution: Combine with more sensitive indicators like MACD or consider shortening EMA length, balancing signal quality and timeliness.
-
Candlestick Pattern Recognition Limitations: The candlestick pattern recognition in the code is relatively simplified and may not capture all complex market patterns. Solution: Optimize pattern recognition algorithms or consider introducing a more comprehensive pattern library.
-
Parameter Optimization Risk: Strategy performance is highly dependent on parameter settings (such as EMA length, RSI thresholds, etc.). Solution: Conduct backtesting analysis to find robust parameters, avoiding curve-fitting issues from excessive optimization.
-
Liquidity Risk: The strategy does not consider market liquidity, which may lead to increased slippage in low-liquidity environments. Solution: Add trading volume filtering conditions to avoid trading in low-liquidity conditions.
Strategy Optimization Directions
-
Add Volatility Filter: Introduce volatility limit conditions in the strategy, such as volatility percentages based on ATR, only trading in environments with moderate volatility to improve signal quality. Reason: Trading signals in extremely high or low volatility environments typically have poorer quality.
-
Enhance Candlestick Pattern Recognition: The current strategy uses basic candlestick pattern recognition. More complex pattern recognition algorithms could be introduced, such as considering longer candlestick sequences or introducing machine learning methods for pattern recognition. Reason: More precise pattern recognition can significantly improve trading signal quality.
-
Optimize Capital Management: Implement dynamic position sizing management, adjusting position size based on signal strength, market volatility, or account performance. Reason: Fixed percentage capital management cannot fully utilize high-quality trading opportunities or reduce exposure in high-risk environments.
-
Add Time Filters: Some markets show better trending characteristics or liquidity during specific time periods. Time filtering conditions could be introduced to execute the strategy only during optimal trading periods. Reason: Market efficiency varies significantly across different time periods.
-
Introduce Multi-timeframe Analysis: Integrate trend analysis from longer timeframes into current timeframe trading decisions, only trading in the direction of the main trend. Reason: Trades aligned with larger trends typically have higher success rates.
Summary
The Multi-Indicator Dynamic Volatility Breakout Strategy is a well-structured and logically rigorous quantitative trading system that forms a comprehensive trading decision framework by integrating EMA trend analysis, RSI momentum assessment, candlestick pattern recognition, and ATR-based risk management. The strategy's greatest advantage lies in its multi-layered signal confirmation mechanism and adaptive risk management system, allowing flexible responses in different market environments.
Despite some inherent risks such as false breakouts and parameter dependency issues, the strategy's robustness and profitability can be further enhanced through targeted optimization measures, including strengthened pattern recognition, introduction of volatility filters, and implementation of multi-timeframe analysis. For investors seeking systematized, rule-clear, and adaptive trading methods, this strategy provides a worthy consideration.
Ultimately, the success of any strategy depends on continuous monitoring and dynamic adjustment. Investors should constantly optimize strategy parameters and trading rules based on market changes and personal risk preferences to achieve long-term stable investment returns.
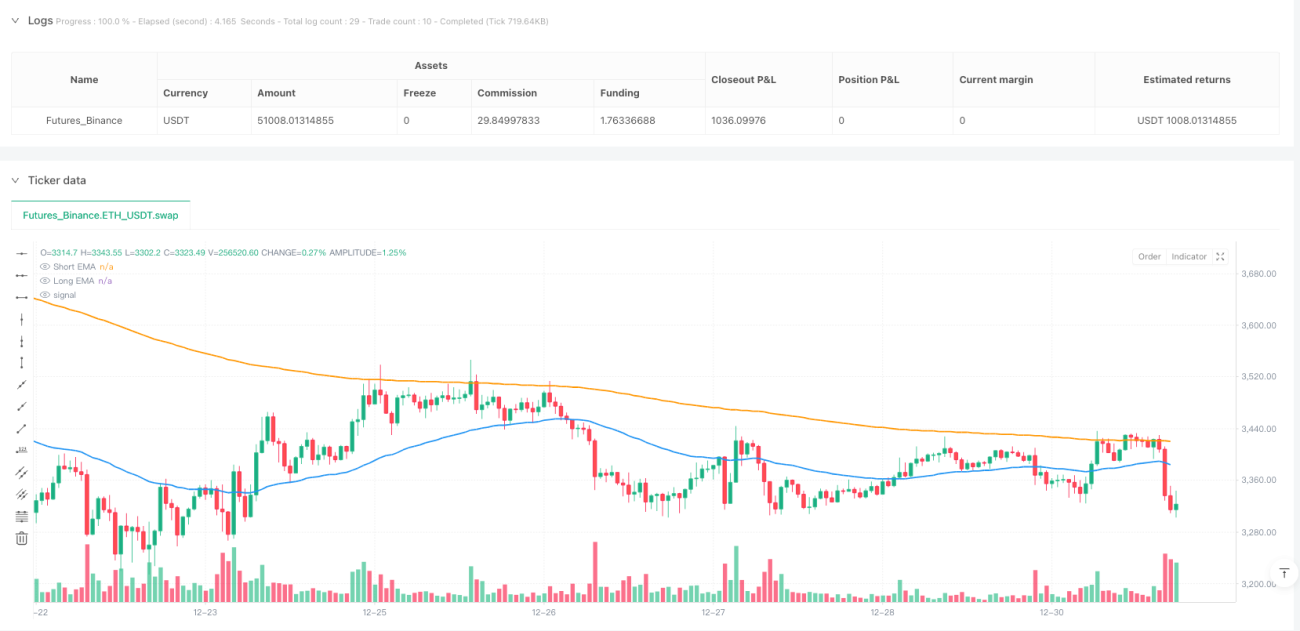
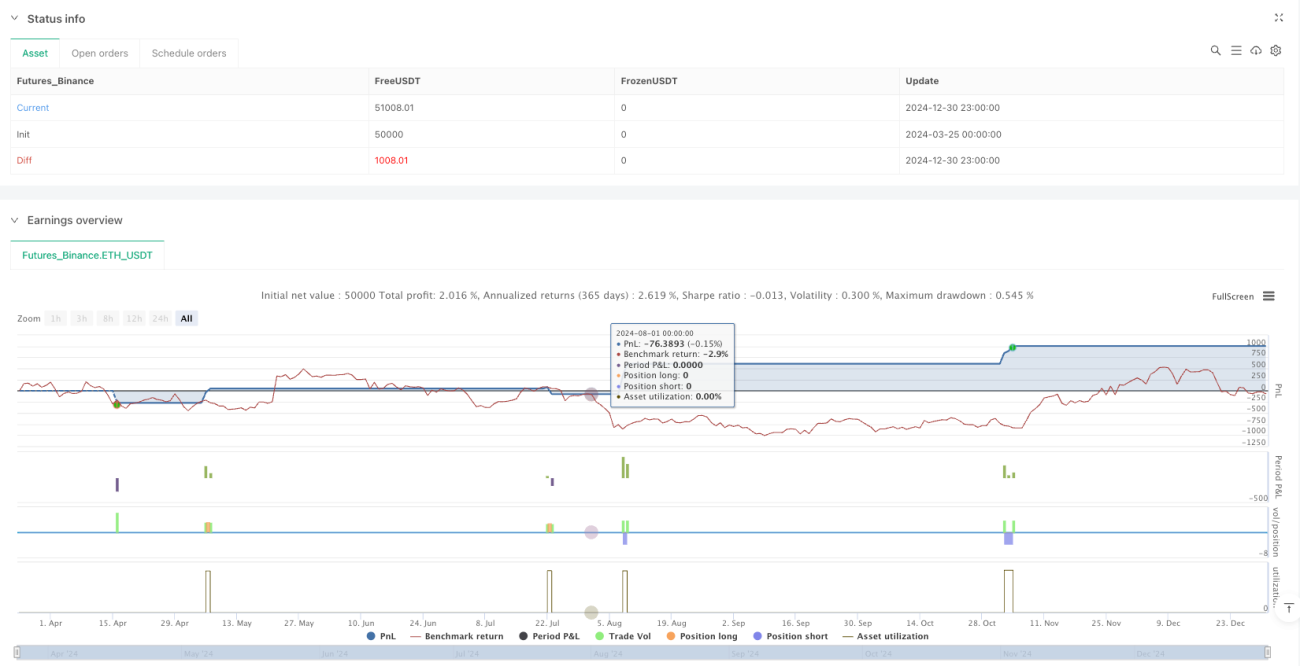
/*backtest
start: 2024-03-25 00:00:00
end: 2024-12-31 00:00:00
period: 1h
basePeriod: 1h
exchanges: [{"eid":"Futures_Binance","currency":"ETH_USDT"}]
*/

//@version=5
strategy("Comprehensive Trading Strategy", overlay=true, pyramiding=1, calc_on_every_tick=true, process_orders_on_close=true, default_qty_type=strategy.percent_of_equity, default_qty_value=20)

// Input Settings- 1