Momentum Breakout Flag Pattern Trading Strategy: Volume-Price Confirmed Intraday High-Frequency Trading System

Overview
The Momentum Breakout Flag Pattern Trading Strategy is an automated system designed for intraday traders, primarily targeting bull flag pattern breakouts in small-cap stocks. The strategy uses ATR (Average True Range) and volume indicators to identify strong upward impulses, then enters trades when price breaks above previous highs with volume confirmation after a flag formation pullback. The system is equipped with an intelligent volume-based partial exit mechanism that effectively responds to changing market pressure, maximizing profit opportunities while controlling risk. The strategy particularly focuses on the morning trading session (9:30-12:00 EST), when market momentum is strongest, providing higher probability trading opportunities.
Strategy Principles
The core principles of this strategy are based on the classic flag pattern recognition in technical analysis and volume-price relationship analysis, including the following steps:
-
Impulse Bar Identification:
- The system first looks for strong bullish impulse bars (large green candles)
- The candle range must be greater than a set ATR multiplier (default 2.0x)
- Volume must be higher than the average volume by a specified multiplier (default 1.5x)
- Identification is only executed during active trading sessions (9:30-12:00)
-
Pullback Confirmation:
- Once an impulse bar is identified, the system enters flag tracking mode
- Records the pullback's lowest price and calculates the pullback percentage
- If the pullback exceeds the maximum pullback percentage (default 50%) or lasts longer than the maximum pullback candles (default 5), the signal is abandoned
-
Breakout Entry:
- Enters a long position when price makes a new high and volume exceeds both the average volume multiplier (default 1.0x) and 100,000
- Executes the entry at the open of the next candle
- Sets the stop-loss at the pullback low
-
Intelligent Exit Mechanism:
- Sets a profit target based on the risk-reward ratio (default 2.0, or 2x the risk)
- Volume-triggered exit mechanism: exits 50% of the position when a red candle appears with volume higher than any candle since entry
- Completely exits the remaining position if another red candle with even higher volume appears
The system implements this complete trading logic through code, specifically including input variable settings, indicator calculations, impulse identification, flag and breakout tracking, and volume-based intelligent exit functionality. The strategy uses a Simple Moving Average (SMA) to calculate average volume, ATR to evaluate market volatility, and combines volume-price relationships for trade signal confirmation.
Strategy Advantages
Through in-depth code analysis, this strategy has the following significant advantages:
-
Automated Bull Flag Pattern Identification: Traditionally, identifying flag patterns requires manual analysis by traders, which can be influenced by subjective factors. This strategy implements objective, consistent pattern recognition through clear mathematical models and parameter settings, reducing human intervention.
-
Volume-Price Relationship Signal Confirmation: The strategy not only focuses on price breakouts but also requires volume confirmation (>100,000 and above average levels), effectively filtering out "false breakouts" and improving the reliability of trading signals.
-
Time Filtering: Focus on morning trading sessions (9:30-12:00), which typically have higher liquidity and volatility, suitable for momentum trading strategies and improving success rates.
-
Dynamic Risk Management:
- Stop-loss points set at pullback lows, aligned with technical analysis logical support levels
- Profit targets based on risk proportion, maintaining consistent risk-reward expectations
- Volume-based partial exit mechanism, capable of adjusting positions in real-time based on market pressure
-
High Customizability: The strategy provides multiple adjustable parameters, including ATR multipliers, volume thresholds, and maximum pullback percentages, allowing traders to optimize based on different market environments and personal risk preferences.
-
Emphasis on Volume Indicators: Compared to strategies that only focus on price, this strategy also emphasizes volume, providing a more comprehensive assessment of market momentum and improving trading accuracy.
Strategy Risks
Despite its many advantages, the strategy also faces the following risks and challenges:
-
Slippage and Liquidity Risk: The strategy targets small-cap stocks, which typically have lower liquidity, potentially causing significant slippage and differences between actual execution prices and theoretical entry prices.
- Solution: Consider setting minimum liquidity filters to avoid trading extremely low liquidity stocks.
-
Time-Specific Risk: The strategy only trades during morning sessions, potentially missing good opportunities at other times. Additionally, market conditions change over time, and early session patterns are not always effective.
- Solution: Consider adding market state filters or adjusting parameters for different time periods.
-
System Parameter Sensitivity: Multiple key parameters (such as ATR multipliers, volume thresholds) need precise adjustment, and different parameter combinations may lead to drastically different results.
- Solution: Conduct extensive backtesting and parameter optimization to find robust parameter combinations.
-
Market Volatility Risk: In highly volatile markets, ATR values can change rapidly, potentially leading to unstable signal quality.
- Solution: Consider using multi-period ATR or adaptive ATR methods to reduce the impact of single-period volatility.
-
Backtest Data Dependency Risk: Strategy performance largely depends on market conditions during the backtesting period, and future performance may differ significantly.
- Solution: Backtest across different market environments and time periods to evaluate strategy performance under various conditions.
-
Fixed Stop-Loss Risk: Setting stops at pullback lows may cause some valid trades to be stopped out due to short-term volatility.
- Solution: Consider using dynamic stop-loss strategies or volatility-based stop settings.
Strategy Optimization Directions
Based on analysis of the strategy code, here are several possible optimization directions:
-
Adaptive Parameter Settings:
- The current strategy uses fixed ATR multipliers and volume thresholds; consider automatically adjusting these parameters based on market volatility
- For example, lower ATR multiplier requirements in low-volatility markets and raise them in high-volatility markets
- Implementation method: Use volatility ranking or relative volatility indicators to dynamically adjust parameters
-
Enhanced Market State Filtering:
- Add overall market trend filters, only trading when aligned with the broader market trend
- Incorporate Relative Strength Index (RSI) or momentum oscillators to ensure bull flag patterns are only sought in strong stocks
- Implementation method: Add logic for judging large index trends or comparing individual stock relative strength to the broader market
-
Improved Exit Strategy:
- The current strategy's exits are primarily based on fixed risk-reward ratios and volume triggers; more flexible exit mechanisms could be added
- Consider using trailing stops that automatically adjust stop positions as prices rise
- Add technically indicator-based exit signals, such as MACD crosses or RSI overbought regions
- Implementation method: Design composite exit logic combining multiple exit conditions
-
Expanded Trading Time Windows:
- Evaluate strategy performance in other trading sessions, and if possible, expand or create parameter sets optimized for different time periods
- Pay special attention to end-of-day trading opportunities, as some stocks may have significant momentum before market close
- Implementation method: Create time period conditional branches, using different parameters for different sessions
-
Integration of Machine Learning Models:
- Use machine learning algorithms to predict the success probability of flag breakouts
- Train models based on historical data to identify the flag feature combinations most likely to succeed
- Implementation method: Collect feature data from successful and failed trades, train classification models as an additional filtering layer
-
Risk Management Optimization:
- Implement dynamic position sizing based on account size
- Adjust risk exposure based on recent trading results to avoid excessive risk after consecutive losses
- Implementation method: Add account size variables and performance tracking logic
Summary
The Momentum Breakout Flag Pattern Trading Strategy is a well-designed intraday trading system, particularly suitable for small-cap stock trading, combining classic flag pattern recognition from technical analysis with advanced volume-price analysis. The strategy creates an objective, repeatable trading system through precisely defined impulse bar identification, pullback confirmation, and breakout entry logic. Its volume-based intelligent partial exit mechanism enhances risk management capabilities, allowing the system to respond quickly to changes in market pressure.
The strategy's main advantages lie in automated pattern recognition, strict volume-price confirmation requirements, and flexible exit mechanisms, which together improve trading accuracy and profit potential. However, the strategy also faces challenges such as slippage risk, parameter sensitivity, and market state dependency.
By implementing the suggested optimization directions, such as adaptive parameter settings, enhanced market state filtering, and improved exit strategies, the system can further increase its robustness and adaptability. Quantitative traders should validate the strategy's performance in different market environments through extensive backtesting and paper trading, adjusting parameters according to individual risk preferences and trading objectives.
Overall, this is a fundamentally sound, logically clear momentum trading strategy suitable for experienced intraday traders, especially those focused on capturing small-cap stock breakout opportunities. With proper risk management and continuous optimization, it has the potential to become an effective tool in a trader's toolkit.
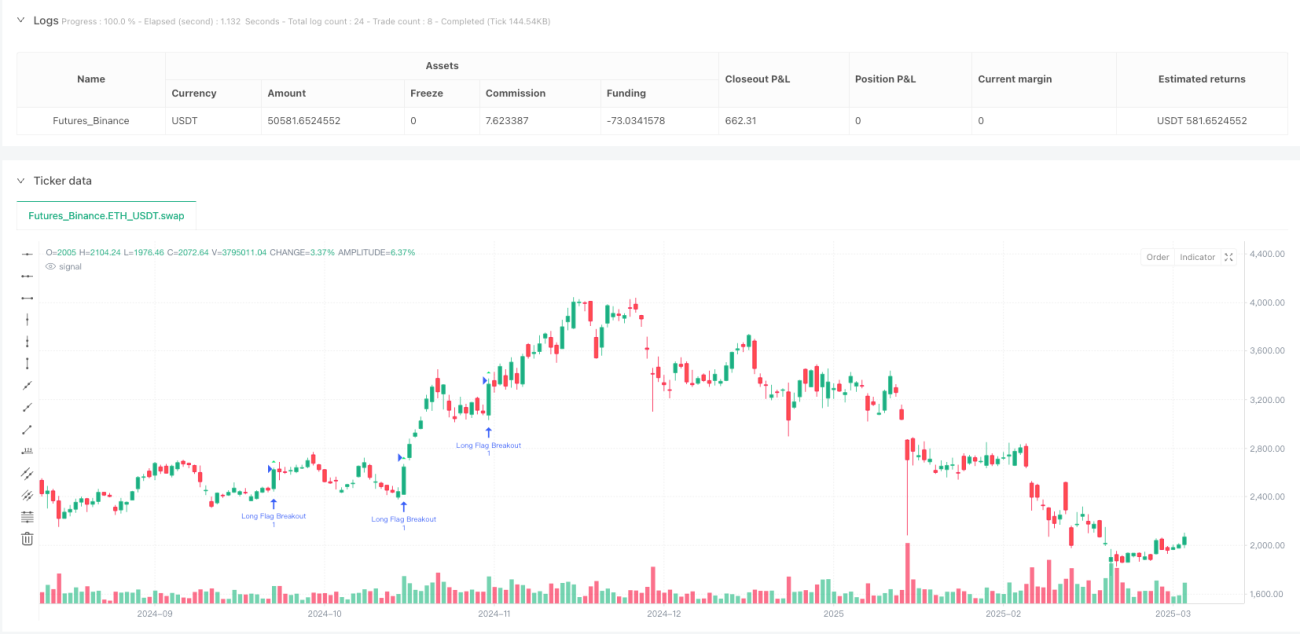
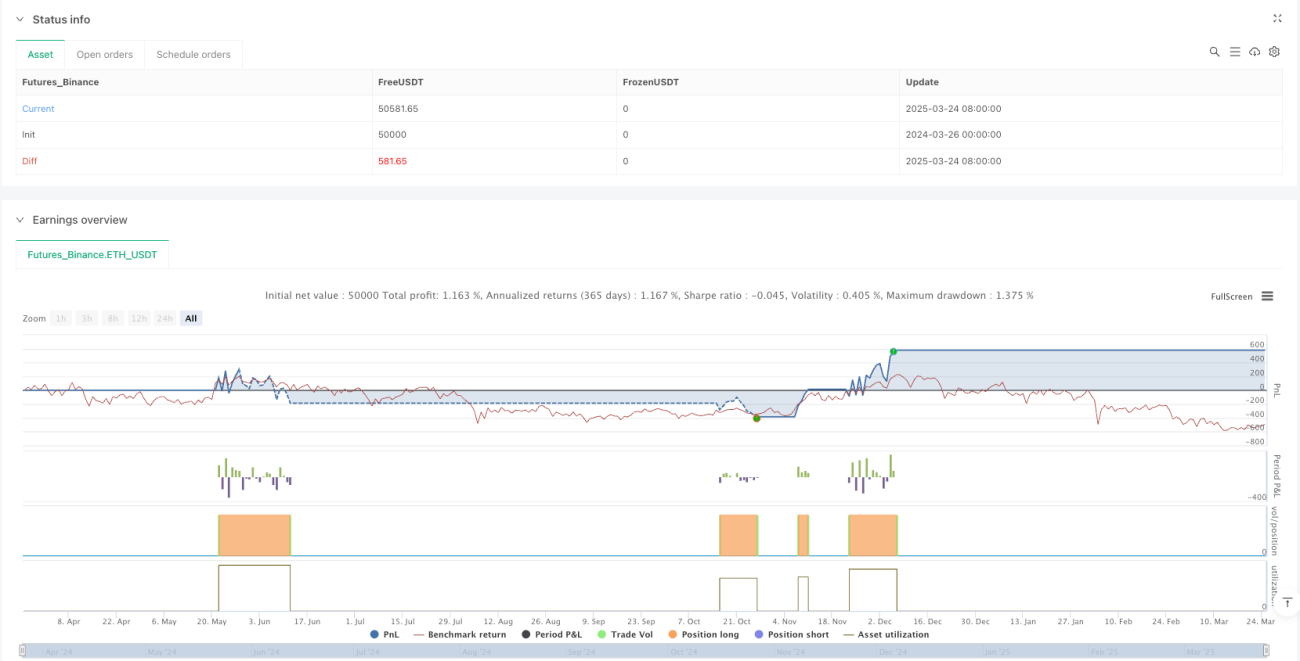
/*backtest
start: 2024-03-26 00:00:00
end: 2025-03-25 00:00:00
period: 1d
basePeriod: 1d
exchanges: [{"eid":"Futures_Binance","currency":"ETH_USDT"}]
*/

//@version=6
strategy(title="Small Cap Bull Flag Pattern Trader v2", shorttitle="BullFlag_1L", overlay=true)
// (1) INPUTS & VARIABLES
impulseATRMultiplier=input.float(2.0,"Impulse:Min Candle Range in ATR"),impulseVolumeMultiplier=input.float(1.5,"Impulse:Vol vs. Avg"),avgVolLen=input.int(20,"Vol SMA Len"),atrLen=input.int(14,"ATR Len"),maxPullbackPct=input.float(50.0,"Max Pullback(%)"),maxPullbackBars=input.int(5,"Max Pullback Bars"),breakoutVolumeMult=input.float(1.0,"Breakout Vol vs. Avg"),rrRatio=input.float(2.0,"R:R Target")- 1