
Overview
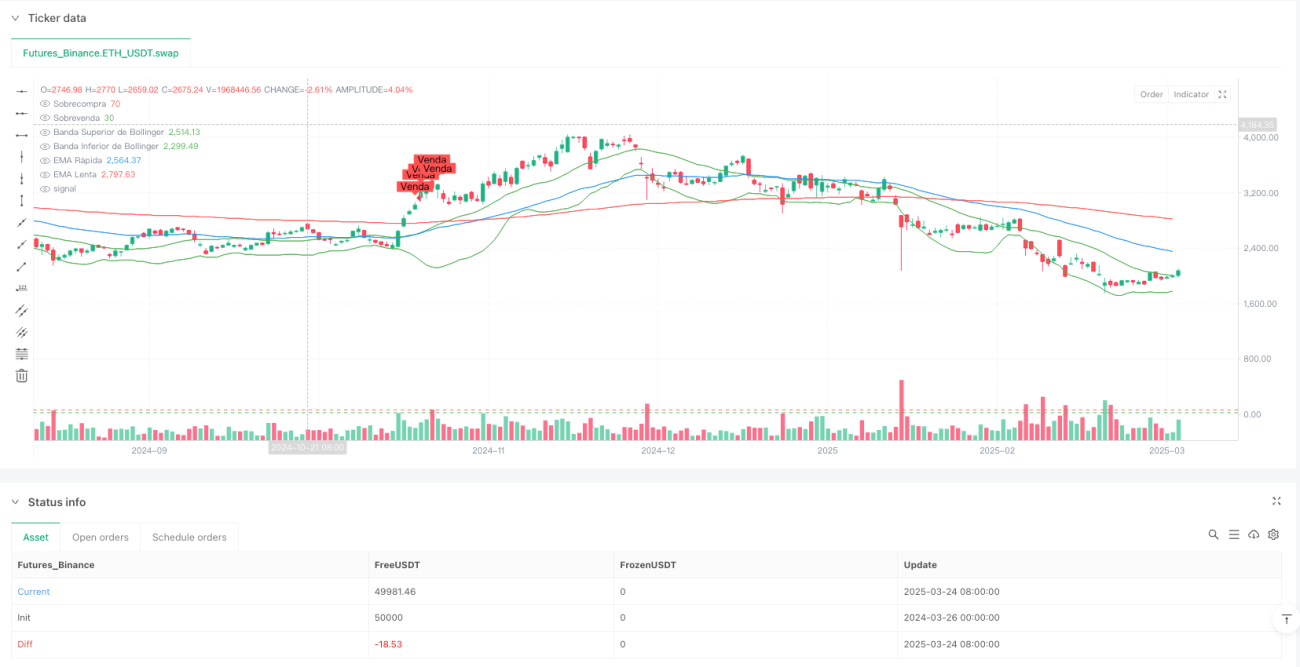
This is a quantitative trading strategy that combines multiple technical indicators, primarily utilizing Exponential Moving Average (EMA), Relative Strength Index (RSI), and Bollinger Bands (BB) to capture market trends and breakout opportunities. The core idea of this strategy is to confirm trends using EMA crossovers, combined with RSI overbought/oversold signals and Bollinger Bands price ranges, to execute trades when prices touch the Bollinger Band boundaries and RSI reaches extreme values. Additionally, the strategy incorporates built-in take-profit and stop-loss mechanisms to control risk and lock in profits.
Strategy Principles
-
Trend Confirmation: The market trend direction is confirmed by comparing the relative positions of the fast EMA (50-period) and slow EMA (200-period). When the fast EMA is above the slow EMA, an uptrend is confirmed; otherwise, a downtrend is confirmed.
-
Entry Signals:
- Buy Condition: A buy signal is generated only when (1) the fast EMA is above the slow EMA (uptrend), (2) the price touches or falls below the lower Bollinger Band, and (3) the RSI is below the oversold level (default 30).
- Sell Condition: A sell signal is generated only when (1) the fast EMA is below the slow EMA (downtrend), (2) the price touches or rises above the upper Bollinger Band, and (3) the RSI is above the overbought level (default 70).
-
Risk Management: The strategy sets fixed take-profit points (default 50 points) and stop-loss points (default 20 points) for each trade, using syminfo.mintick for price precision adjustments.
-
Position Sizing: The amount of capital allocated to each trade is controlled through the adjustable lotSize parameter (default 0.1).
Strategy Advantages
-
Multi-Indicator Confirmation: This strategy combines trend indicators (EMA), momentum indicators (RSI), and volatility indicators (Bollinger Bands) to confirm signals from multiple perspectives, reducing the risk of false breakouts.
-
Combination of Counter-Trend and Trend Confirmation: The strategy seeks short-term corrective opportunities against the background of a confirmed long-term trend, respecting the long-term trend while entering at price retracements, improving entry point quality.
-
Reasonable Risk-Reward Ratio: Under default settings, the strategy has a risk-reward ratio of 1:2.5 (20-point stop-loss : 50-point take-profit), aligning with sound risk management principles.
-
Strong Parameter Adjustability: The strategy offers multiple adjustable parameters, including EMA periods, RSI thresholds, and take-profit/stop-loss points, allowing users to customize based on different market environments and personal risk preferences.
-
Visual Trading Signals: The strategy intuitively displays buy and sell signals through shape markers on the chart, facilitating analysis and review by traders.
Strategy Risks
-
Trend Reversal Risk: Relying on EMA for trend determination may lead to lag during extreme market volatility, causing missed opportunities at the beginning of trend reversals or generating false signals. This can be addressed by introducing more sensitive trend indicators like MACD or adding breakout confirmation mechanisms.
-
Parameter Sensitivity: The strategy's performance is highly dependent on parameter settings, with different market environments potentially requiring different parameter combinations. It's recommended to conduct backtesting to find optimal parameter combinations under various market conditions.
-
False Breakout Risk: Despite using multiple indicators for confirmation, false breakouts may still occur in highly volatile markets. This risk can be reduced by adding volume confirmation or waiting for a rebound before entering.
-
Limitations of Fixed Take-Profit and Stop-Loss: Fixed-point take-profit and stop-loss may not adapt to different market volatilities, potentially being too small during high volatility periods and too large during low volatility periods. Consider using ATR to dynamically adjust take-profit and stop-loss levels.
-
Lack of Volume Analysis: The current strategy does not consider volume factors, which may lead to false signals in low-liquidity environments. It's advisable to introduce volume indicators to enhance strategy reliability.
Strategy Optimization Directions
-
Dynamic Take-Profit and Stop-Loss: Replace fixed-point take-profit and stop-loss with ATR-based (Average True Range) dynamic levels to better adapt to changing market volatility. For example: stopLoss = atrValue * 1.5, takeProfit = atrValue * 3.
-
Add Filtering Conditions: Introduce volume indicators or other market structure indicators (such as price patterns, support/resistance) as additional filtering conditions to improve signal quality.
-
Optimize Parameter Adaptability: Implement a dynamic parameter adjustment mechanism that automatically adjusts EMA periods, RSI thresholds, and other parameters based on market volatility, improving the strategy's adaptability across different market environments.
-
Add Time Filters: Incorporate time filtering functionality to avoid trading during major economic data releases or low-liquidity sessions, reducing risks from slippage and abnormal price movements.
-
Partial Position Management: Introduce phased entry and partial profit-taking mechanisms, rather than entering or exiting all at once, improving capital utilization efficiency and risk diversification.
-
Introduce Trend Strength Indicators: Add trend strength indicators such as ADX (Average Directional Index), executing trades only when trend strength reaches a certain level, avoiding frequent trading in ranging markets.
Conclusion
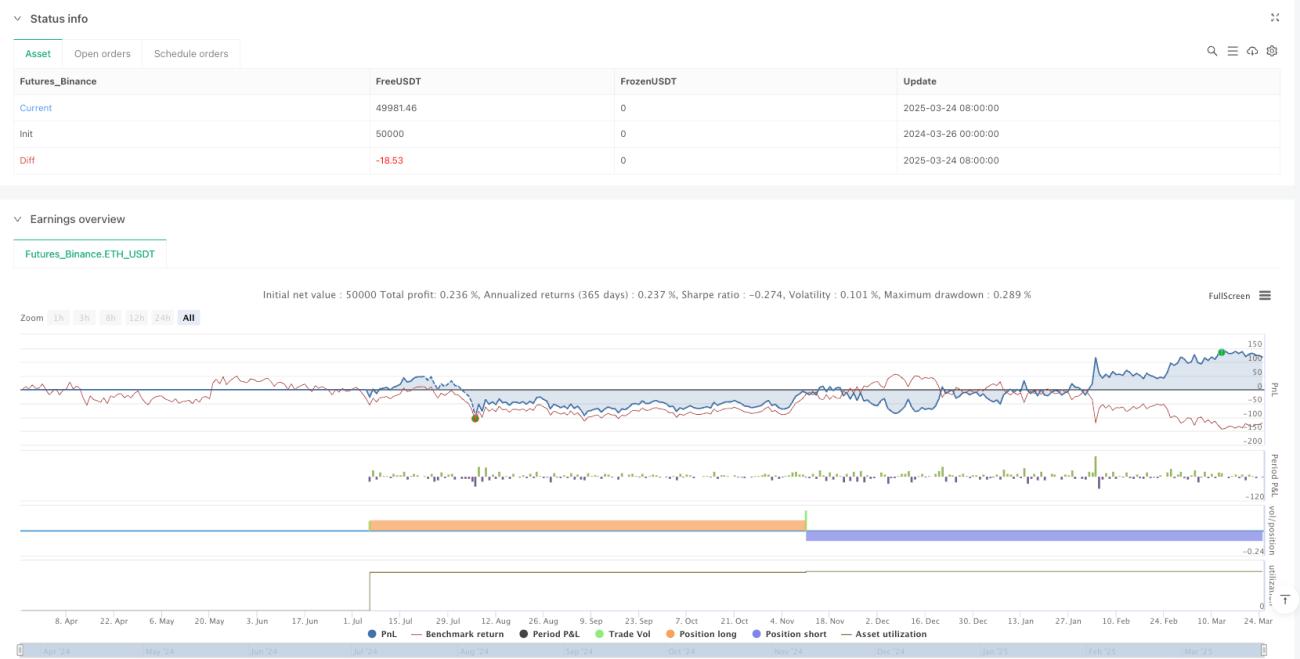
This Multi-Indicator Cross Momentum Trading Strategy constructs a relatively complete trading system by combining EMA trend determination, RSI overbought/oversold signals, and Bollinger Bands price channels. The core advantage of the strategy lies in its multi-indicator collaborative signal confirmation, capturing short-term counter-trend opportunities while respecting long-term trends, and controlling risk through built-in take-profit and stop-loss mechanisms.
However, the strategy also faces risks such as high parameter sensitivity and potential false breakouts. By introducing dynamic take-profit and stop-loss, adding filtering conditions, optimizing parameter adaptability, and other improvements, the strategy's robustness and adaptability can be further enhanced.
For investors who prefer technical analysis and quantitative trading, this strategy provides a solid foundation framework that can be customized and optimized according to individual trading styles and market conditions to achieve better trading results.
- 1