
Overview
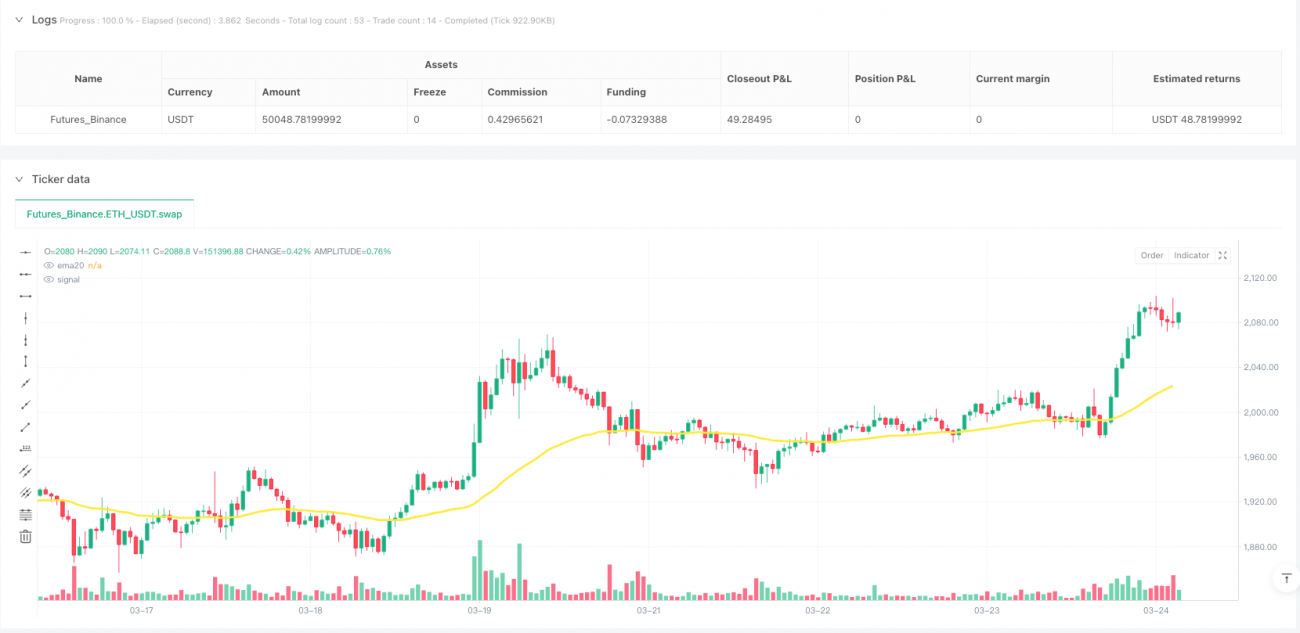
This is a mean reversion trading strategy that capitalizes on significant deviations between price and the 50-period Exponential Moving Average (EMA). Specifically designed for volatile markets, the strategy aims to profit by buying when prices fall substantially below the EMA and selling when they recover above it. The strategy primarily tracks the percentage difference between price and EMA, triggering trading signals when this difference exceeds specific thresholds.
Strategy Principle
The core logic is based on the mean reversion theory, which suggests that while prices may deviate from their mean in the short term, they tend to revert to it over time. The strategy uses a 50-period EMA as a reference point for the mean price. When the price falls significantly below this average (over 10%), it's considered a buying opportunity. When the price recovers above the EMA and shows a profit, it triggers a sell signal. The calculation is as follows:
- Uses a 50-period EMA as the baseline
- Calculates the percentage deviation of price from EMA:
diff_perct = ((ema20 - close) / ema20) * 100 - Calculates the percentage deviation of high price from EMA:
diff_perct2 = ((high - ema20) / ema20) * 100 - When
diff_perct > 10(i.e., price is more than 10% below EMA), a buy signal is triggered - When
diff_perct2 > 0(i.e., high price is above EMA) and the current trade is profitable (profit > 1), a sell signal is triggered
Strategy Advantages
- Clear Entry Conditions: The strategy sets a specific price deviation threshold (10%), providing clear entry signals and reducing subjective judgment interference.
- Capitalizes on Market Overreactions: The strategy aims to capture opportunities during excessive market panic or downturns when asset prices are often undervalued.
- Automated Execution: The strategy can be fully automated, eliminating the need for constant monitoring and reducing emotional interference.
- Flexible Capital Management: The strategy uses cash allocation rather than fixed units, allowing for more flexible capital utilization.
- Simplicity: Compared to complex multi-indicator strategies, this strategy is straightforward, easy to understand, and adjust.
- Risk Control: The sell signal is only triggered when there is already a profit, helping to protect realized gains.
Strategy Risks
- Trend Risk: In strong downtrend markets, prices may continuously deviate from the EMA without reverting, leading to the "catching falling knives" phenomenon and sustained losses.
- Parameter Sensitivity: The 10% deviation threshold may not be suitable for all market conditions, potentially failing to trigger in low-volatility environments or triggering too frequently in high-volatility ones.
- Lack of Stop-Loss Mechanism: The code doesn't include explicit stop-loss settings, which could lead to significant losses if the market deteriorates continuously.
- Dependence on EMA Accuracy: The strategy assumes the EMA is an effective reference for price, which may not hold true under certain market conditions.
- Liquidity Risk: In less liquid markets, buy or sell orders may face slippage or incomplete execution.
- Fixed Profit Threshold: The profit threshold is set at a fixed value of 1, without considering adaptive adjustments based on different market volatilities.
Optimization Directions
- Dynamic Deviation Threshold: Replace the fixed 10% deviation threshold with a dynamic one based on recent volatility, perhaps using the Average True Range (ATR) indicator.
- Add Stop-Loss Mechanism: Introduce time-based or price-based stop-loss conditions, such as maximum holding time or maximum allowable loss percentage.
- Multi-Timeframe Confirmation: Incorporate trend judgments from longer timeframes (such as daily or weekly) to avoid entering positions against the primary trend.
- Staged Position Building and Closing: Implement graduated buying and staged selling instead of establishing or closing all positions at once to distribute risk.
- Additional Filtering Conditions: Add extra technical indicators (such as RSI or MACD) as filtering conditions to improve signal quality.
- Adaptive EMA Period: Experiment with an adaptive EMA period instead of a fixed 50-period to better adjust to changing market conditions.
- Backtesting Optimization: Conduct extensive backtesting under different market cycles and conditions to find optimal parameter combinations.
Summary
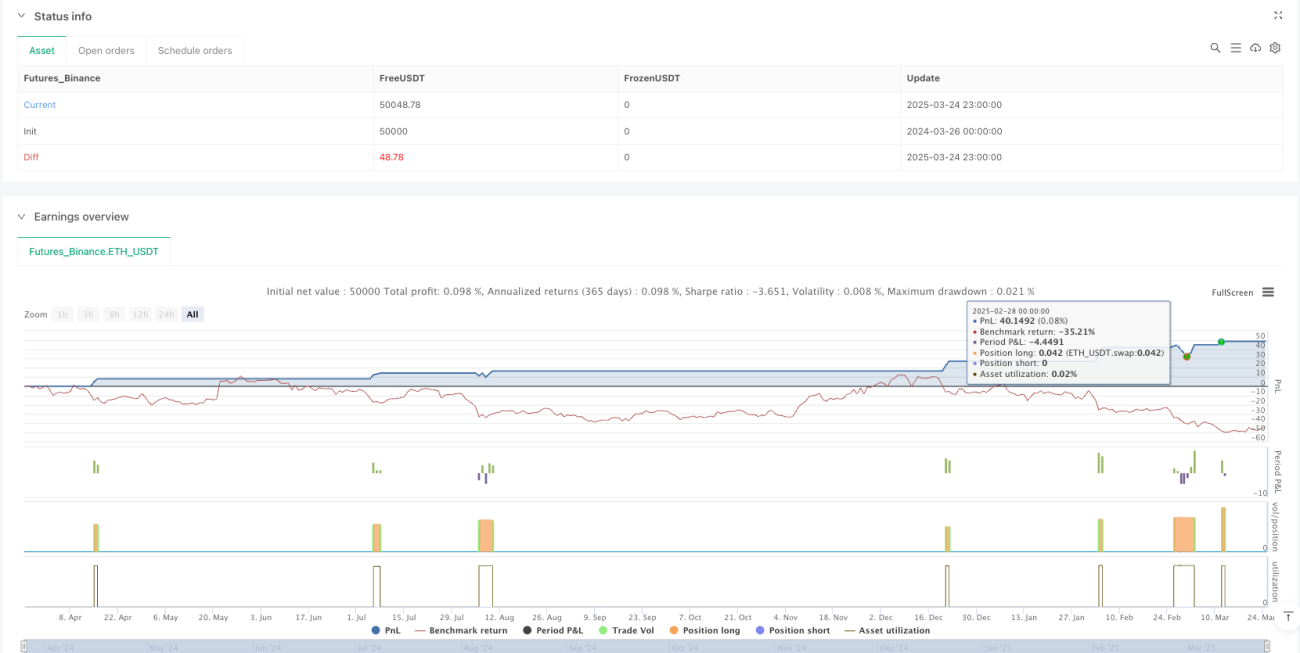
The 50-Period EMA Divergence Mean Reversion Strategy is an automated trading system based on technical analysis that seeks trading opportunities by capturing significant deviations between price and moving averages. The strategy is simple and intuitive, suitable for markets with higher volatility, but also carries certain risks, especially in strong trending markets. By adding stop-loss mechanisms, dynamic parameter adjustments, and multi-indicator confirmations, the strategy's robustness and profitability can be significantly enhanced. Ideally, this strategy would serve as part of a more comprehensive trading system rather than being used in isolation.
/*backtest
start: 2024-03-26 00:00:00
end: 2025-03-25 00:00:00
period: 1h
basePeriod: 1h
exchanges: [{"eid":"Futures_Binance","currency":"ETH_USDT"}]
*/

//@version=5
strategy("SUIBTC 2H - EMA dip public",overlay=true,initial_capital=100,default_qty_value=100, default_qty_type = strategy.cash,process_orders_on_close=false,calc_on_every_tick=false)
- 1