RSI Momentum Reversal Short-Term Trend-Following Strategy with Moving Average Confluence

Overview
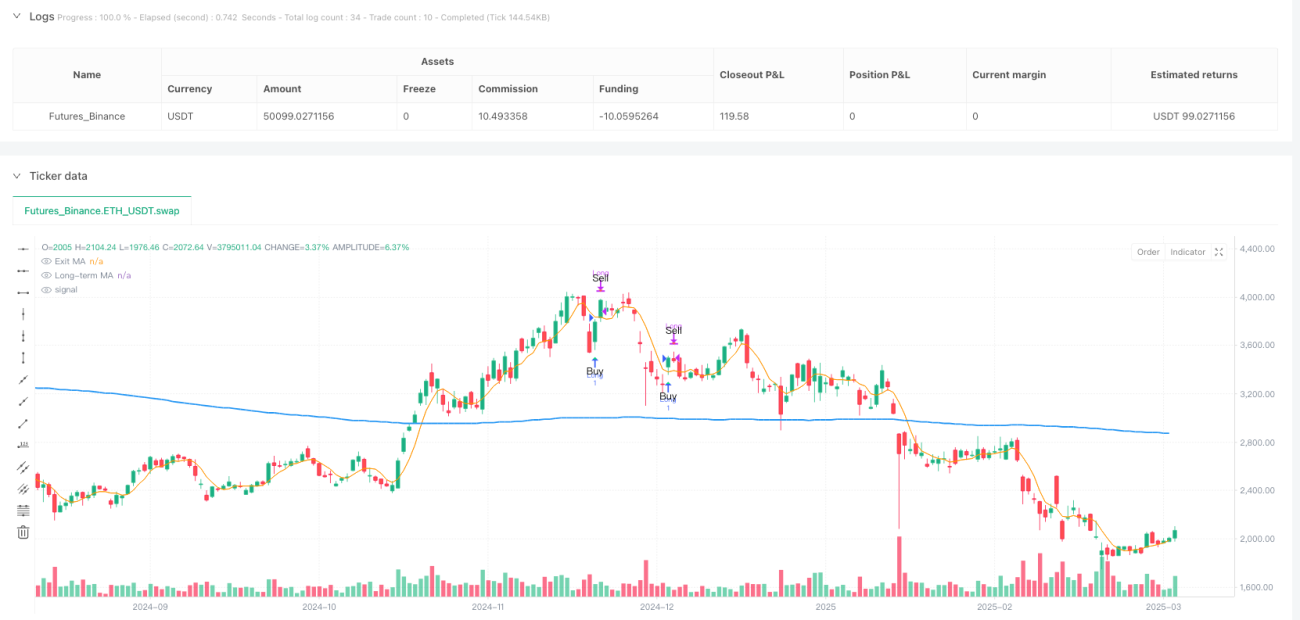
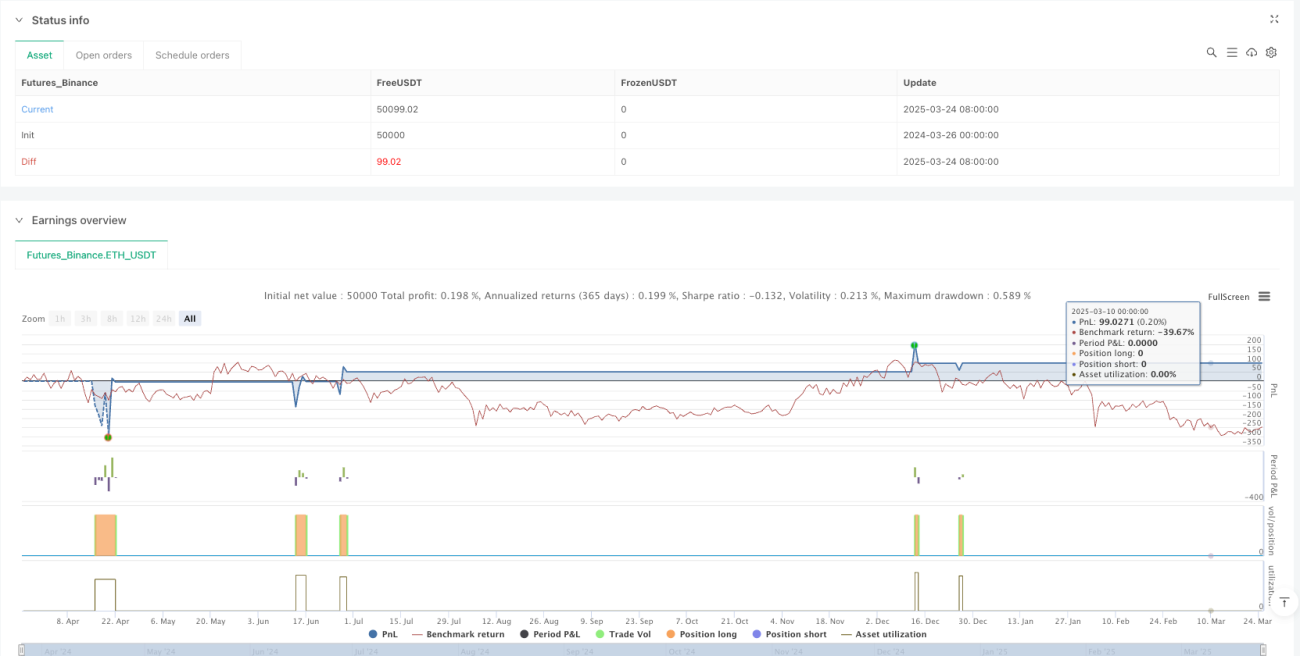
This strategy is an RSI oversold reversal trend-following trading system, with the core idea of seeking short-term oversold pullback opportunities in strong uptrends. The strategy utilizes a 2-period RSI indicator dropping below an extremely oversold level (below 5) and then rebounding as an entry signal, while combining a long-term moving average (default 200 periods) to confirm that the market is in an overall uptrend. This approach is particularly suitable for trading ETFs like SPY, QQQ, and large technology stocks, capable of capturing high-probability rebound opportunities after short-term market oversold conditions. The strategy employs a 5-period moving average as the profit-taking point to secure reasonable profits. According to backtesting data, this strategy has demonstrated a win rate of over 60% across various timeframes, suitable for intraday and short-term swing trading.
Strategy Principles
The operating principles of this strategy are built on the synergistic effects of several key technical indicators:
-
Trend Confirmation: The strategy uses a 200-period Simple Moving Average (SMA) as the primary trend filter. Entry is only considered when the price is above this long-term average, ensuring we only buy in uptrends and avoid counter-trend operations in bear markets.
-
Oversold Condition Identification: A 2-period RSI indicator is used to monitor short-term oversold conditions. When the RSI drops below the extremely low level of 5, it suggests the market may be oversold, but the strategy does not enter immediately.
-
Precise Entry Timing: The critical entry condition is when RSI crosses above 5 from a level below 5. This crossover signal indicates that momentum has begun to shift from extremely pessimistic to positive, signaling a buying opportunity. The code uses the
ta.crossover(rsiValue, rsiBuyLevel)function to precisely capture this moment. -
Intelligent Profit-Taking: Once a position is established, the strategy monitors the relationship between price and the 5-period SMA. When the price closes above this short-term average, indicating that a short-term rebound has materialized, the strategy automatically closes the position for profit. This exit mechanism both secures reasonable profits and avoids premature exits that could reduce gains.
-
Optional Risk Control: The strategy has a built-in percentage stop-loss mechanism, allowing users to set a stop-loss level as a percentage of the entry price. When this feature is enabled, if the price drops beyond the set percentage, the strategy will automatically close the position to limit losses.
The core advantage of the strategy lies in its combination of trend-following and reversal trading elements, seeking short-term reversal opportunities only within strong trends, thereby increasing the probability of successful trades.
Strategy Advantages
Through in-depth analysis of the strategy code, we can summarize the following significant advantages:
-
High Win-Rate Potential: By capturing rebounds only after extreme oversold conditions within confirmed uptrends, the strategy increases the probability of successful trades. Backtesting shows win rates above 60% on SPY and large-cap stocks.
-
Perfect Blend of Trend and Reversal: The strategy successfully combines trend following (via 200-period MA) and reversal trading (via RSI oversold rebounds), avoiding the risks of pure reversal trading while capturing favorable entry points within trends.
-
Strong Adaptability: The strategy is effective across multiple timeframes, from 5-minute, 10-minute, 1-hour intraday trading to 2-hour and daily short-term swing trading, providing traders with tremendous flexibility.
-
Clear Entry and Exit Rules: The strategy provides precise entry conditions (RSI crossing above 5 from below) and exit conditions (price closing above the 5-period MA), eliminating subjective judgment in trading and helping maintain trading discipline.
-
Built-in Risk Management: The optional percentage stop-loss mechanism provides an additional layer of risk control for the strategy, allowing traders to adjust parameters according to their personal risk tolerance.
-
Visual Assistance: The strategy marks buy and sell signals on the chart, enabling traders to visually identify trading opportunities and manage positions.
-
Parameter Adjustability: All key parameters (RSI length, oversold threshold, trend MA length, exit MA length, and stop-loss percentage) can be adjusted according to different markets and personal preferences, enhancing the strategy's adaptability.
Strategy Risks
Despite its many advantages, the strategy also has some potential risks that traders should be aware of and take corresponding measures:
-
False Breakout Risk: In extremely volatile markets, RSI may produce false breakouts, leading to erroneous signals. Solution: Consider adding confirmation conditions, such as requiring the RSI breakout to persist for a certain period or combining with other indicators for confirmation.
-
Trend Change Risk: The 200-period MA may lag in response during the early stages of trend changes, potentially generating inappropriate signals in emerging bear markets. Solution: Consider adding more sensitive trend indicators as supplements, such as shorter-term moving average crossovers or price channel breakouts.
-
Premature Profit-Taking: Using the 5-period MA as an exit point may lead to taking profits too early during stronger rebounds. Solution: Implement a partial profit-taking strategy, or use a longer-period MA as the exit condition.
-
Parameter Sensitivity: Strategy performance is highly sensitive to parameters such as RSI length and oversold threshold. Solution: Thorough parameter optimization and historical backtesting should be conducted before live trading to find the parameter combinations best suited for specific markets and timeframes.
-
Market Environment Adaptability: The strategy may perform poorly in range-bound or bear markets. Solution: This strategy should be used only in clearly bullish market environments, or additional market environment filters should be added.
-
Liquidity Risk: Although the strategy is designed for highly liquid instruments like SPY and QQQ, it may face liquidity issues when applied to smaller-cap stocks. Solution: Limit the strategy's application to highly liquid assets, or adjust position sizes to accommodate different liquidity conditions.
Strategy Optimization Directions
Based on code analysis, I recommend the following optimization directions to enhance the strategy's robustness and performance:
-
Dynamic RSI Threshold: The current strategy uses a fixed RSI threshold (5) as the oversold criterion, but the optimal threshold may vary in different market environments. Optimization direction: Implement a dynamic RSI threshold that automatically adjusts based on historical volatility or market conditions, for example, raising the threshold during low volatility periods and lowering it during high volatility periods.
-
Multi-Timeframe Confirmation: To reduce false signals, a multi-timeframe confirmation mechanism can be added. Optimization direction: Require RSI conditions to be met simultaneously on both lower and higher timeframes, thereby increasing signal reliability.
-
Advanced Trend Filtering: The current trend filter uses only a single 200-period MA. Optimization direction: Add a combination of Exponential Moving Averages (EMAs) and Simple Moving Averages (SMAs) for judgment, or use trend strength indicators like ADX to assess trend quality.
-
Partial Profit Strategy: The current single exit point may not maximize profits. Optimization direction: Implement a staged profit-taking mechanism, such as closing portions of the position at different price targets, while using trailing stops to protect remaining profits.
-
Time Filter: Certain market sessions may be more suitable for this type of strategy. Optimization direction: Add time filtering conditions to trade only during statistically advantageous time windows, avoiding inefficient periods.
-
Volume Confirmation: The current strategy does not consider volume factors. Optimization direction: Add volume confirmation to entry conditions, such as requiring volume to increase during RSI rebounds, to enhance the reliability of reversal signals.
-
Adaptive Parameters: Fixed parameters may perform differently across market phases. Optimization direction: Implement an automatic parameter adjustment system based on historical data, allowing the strategy to self-optimize according to recent market behavior.
The above optimization directions can be implemented individually or in combination, but thorough backtesting should be conducted after each modification to ensure that the improvements actually enhance the strategy's overall performance.
Summary
The "RSI Momentum Reversal Short-Term Trend-Following Strategy with Moving Average Confluence" is a well-designed trading system that combines trend-following and oversold reversal trading concepts to seek high-probability buying opportunities in uptrends. Its core logic is to use a 200-period moving average to confirm an uptrend, then wait for a 2-period RSI to drop below the extremely oversold level of 5 and rebound, as the optimal buying opportunity, finally taking profits when the price closes above the 5-period moving average.
This strategy is particularly suitable for trading ETFs like SPY, QQQ, and large technology stocks, and can be applied across multiple timeframes from minutes to daily charts. The strategy's main advantages lie in its high win-rate potential, clear trading rules, and strong adaptability, while its primary risks come from false breakouts, parameter sensitivity, and market environment changes.
By implementing the suggested optimization directions, such as dynamic RSI thresholds, multi-timeframe confirmation, advanced trend filtering, and partial profit strategies, traders can further enhance the robustness and profitability of this strategy. Ultimately, this is an effective tool for capturing short-term pullback opportunities in strong markets, suitable for investors seeking high win-rate trading methods.
- 1