Dynamic Multi-Timeframe ATR Crossover Strategy: Optimizing Trend Following and Risk Management with Flexible Parameters

EMA RSI ATR 趋势跟踪 动态参数 多时间框 止损 止盈 尾随止损
Created on: 2025-03-26 16:40:51 Modified on: 2025-03-26 16:40:51
Copy: 0 Number of hits: 431
avatar of ianzeng123 ianzeng123
2
Follow
319
Followers

 Dynamic Multi-Timeframe ATR Crossover Strategy: Optimizing Trend Following and Risk Management with Flexible Parameters  Dynamic Multi-Timeframe ATR Crossover Strategy: Optimizing Trend Following and Risk Management with Flexible Parameters

Overview

The Dynamic Multi-Timeframe ATR Crossover Strategy is a versatile trading system that automatically adjusts key parameters based on different timeframes. This strategy combines Exponential Moving Average (EMA) crossover signals and Relative Strength Index (RSI) confirmation, while utilizing Average True Range (ATR) for dynamic risk management. Whether you’re trading on daily charts, weekly charts, or various minute charts (such as 5-minute, 30-minute, 60-minute, or 4-hour charts), the strategy intelligently adjusts parameters to adapt to different market environments, effectively filtering false signals and improving trading success rates.

Strategy Principles

The core principles of this strategy are based on the synergistic effect of multiple technical indicators and dynamic parameter adjustment mechanisms:

  1. Multi-Timeframe Parameter Adaptation: The strategy automatically selects optimal indicator parameters based on the current timeframe (daily, weekly, 30-minute, 60-minute, 4-hour, or 5-minute). For example, it uses longer EMA periods and standard RSI parameters on daily charts, while on 30-minute charts, it converts “days” into corresponding “bars” and slightly reduces period values to improve responsiveness.

  2. Signal Generation Logic:

    • Long Entry: Generated when the fast EMA crosses above the slow EMA and the RSI is above 50.
    • Short Entry: Generated when the fast EMA crosses below the slow EMA and the RSI is below 50. This dual confirmation mechanism effectively reduces false signals.
  3. Risk Management Framework:

    • ATR-based Stop Loss: For long positions, the stop loss is set at “Current Price - (ATR × Stop Loss Multiplier)”; for short positions, it’s set at “Current Price + (ATR × Stop Loss Multiplier)”.
    • ATR-based Take Profit: Similarly, take profit levels are determined using ATR multiplied by a profit multiplier.
    • Dynamic Trailing Stop: An optional feature that dynamically adjusts the stop loss position based on ATR, following price movements in the favorable direction to lock in partial profits.
  4. Capital Allocation: Each trade uses 10% of total funds, allowing the strategy to scale with account size through percentage-based position management.

Strategy Advantages

  1. Multi-Timeframe Flexibility: The strategy seamlessly adapts to different timeframes, maintaining consistent trading logic while adjusting parameters to match the market characteristics of specific timeframes. This allows traders to apply the same strategy across different time scales, enhancing its practicality.

  2. Reliable Signal Filtering: Through the dual verification mechanism requiring both EMA crossovers and RSI confirmation, the strategy significantly reduces false signals. While this may lead to slightly delayed entries, it greatly improves signal quality and reliability.

  3. Dynamic Risk Management: Using ATR for stop loss and take profit settings enables the strategy to adapt to changes in market volatility. It automatically widens stop loss ranges in more volatile markets and tightens them in calmer markets, making it more intelligent than fixed-point stop losses.

  4. Visually Friendly Display: The strategy employs a colorblind-friendly palette (Okabe-Ito palette), making it easy for traders with different visual abilities to identify various indicators and signals on the chart.

  5. Parameter Customizability: All key parameters can be adjusted through the input panel, allowing traders to fine-tune strategy performance for different assets or market conditions.

Strategy Risks

  1. Delayed Reaction to Trend Changes: Since the strategy relies on EMA crossovers and RSI confirmation, it may exhibit lag in rapidly reversing markets, leading to less than ideal entry points or stop losses being triggered. The solution is to consider using shorter EMA periods or lowering RSI thresholds for high-volatility markets.

  2. False Breakout Risk: Despite using a dual confirmation mechanism, the strategy may still generate false breakout signals in range-bound, oscillating markets. This risk can be mitigated by adding additional filtering conditions (such as volume confirmation or volatility indicators).

  3. Parameter Optimization Trap: Over-optimizing parameters for specific timeframes may lead to overfitting, resulting in poor performance in future market environments. Parameters should be regularly reassessed and backtested under different market conditions to ensure robustness.

  4. Fixed Capital Allocation: The current strategy allocates a fixed 10% of funds to each trade, which may not be suitable for all market conditions or risk preferences. Consider implementing a dynamic fund management system that adjusts position size based on market volatility or signal strength.

Strategy Optimization Directions

  1. Adaptive Parameter Optimization: Currently, the strategy selects parameters for different timeframes based on preset values. It could be further developed to dynamically adjust parameters based on market states (such as volatility, trend strength), for example, using longer EMA periods in high-volatility markets to reduce noise.

  2. Multi-Indicator Fusion: Consider integrating other complementary indicators, such as volume indicators or trend strength indicators (like ADX), to enhance signal quality. In particular, using volume as a confirmation factor can significantly reduce the possibility of false breakouts.

  3. Intelligent Fund Management: Upgrade the existing fixed percentage fund allocation to a dynamic system based on volatility and signal strength. For example, increase position size when RSI and EMA crossovers provide strong signals, and decrease it otherwise, optimizing the risk-reward ratio.

  4. Time Filters: Introduce time filters based on trading sessions and market activity. Some markets are more directional or more prone to false signals during specific time periods; avoiding these periods can improve overall strategy performance.

  5. Machine Learning Enhancement: Apply machine learning methods to parameter optimization and signal filtering, helping the strategy better adapt to changing market conditions, identify non-linear patterns, and dynamically adjust to optimal parameter configurations.

Summary

The Dynamic Multi-Timeframe ATR Crossover Strategy is a carefully designed trading system that balances trading opportunities and risk control through flexible parameter adjustment, reliable signal validation, and robust risk management. Its uniqueness lies in its ability to seamlessly adapt to various timeframes from minutes to weeks, maintaining consistent trading logic while optimizing parameters for specific time ranges.

Although the strategy may exhibit some lag in rapidly reversing markets, its focus on confirming genuine trends helps reduce erroneous trades, which is crucial for long-term trading success. By further integrating adaptive parameters, multi-indicator fusion, and intelligent fund management, the strategy has the potential to provide more robust performance across various market environments.

For traders seeking a comprehensive and adaptable technical trading system, this strategy provides a solid framework that can be applied directly or used as a foundation for more complex systems. Most importantly, its design philosophy emphasizes how trading systems should intelligently adapt to different market environments rather than trying to approach all situations with fixed parameters, which is a key principle for successful trading.
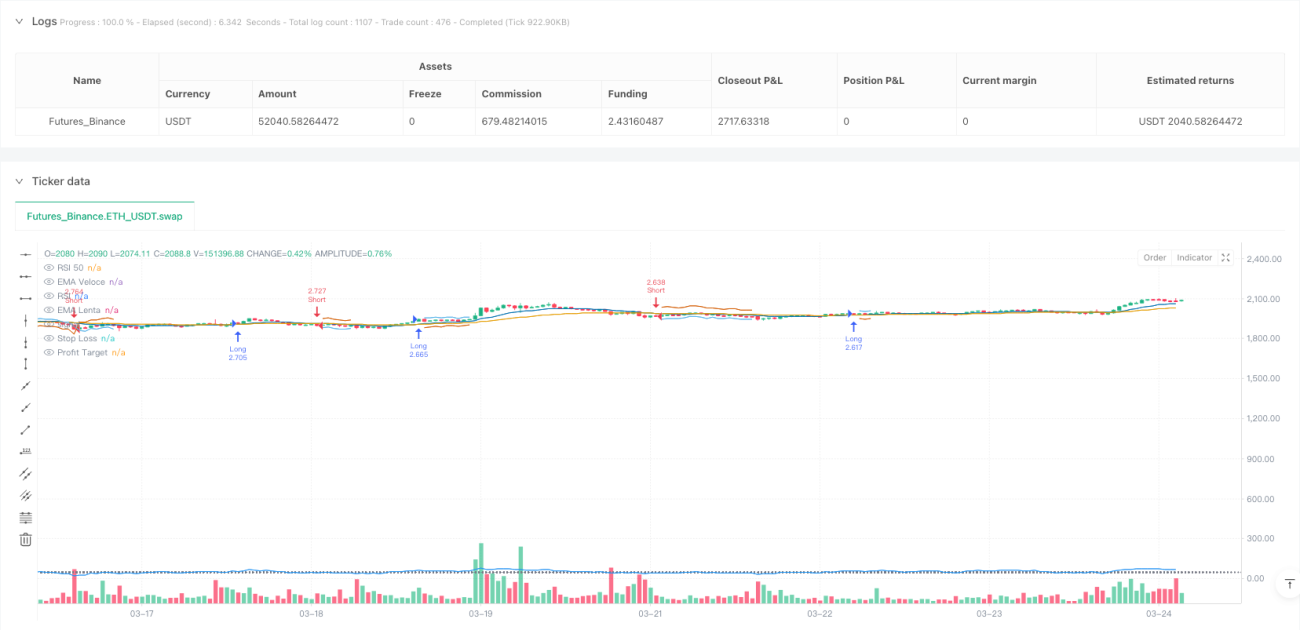
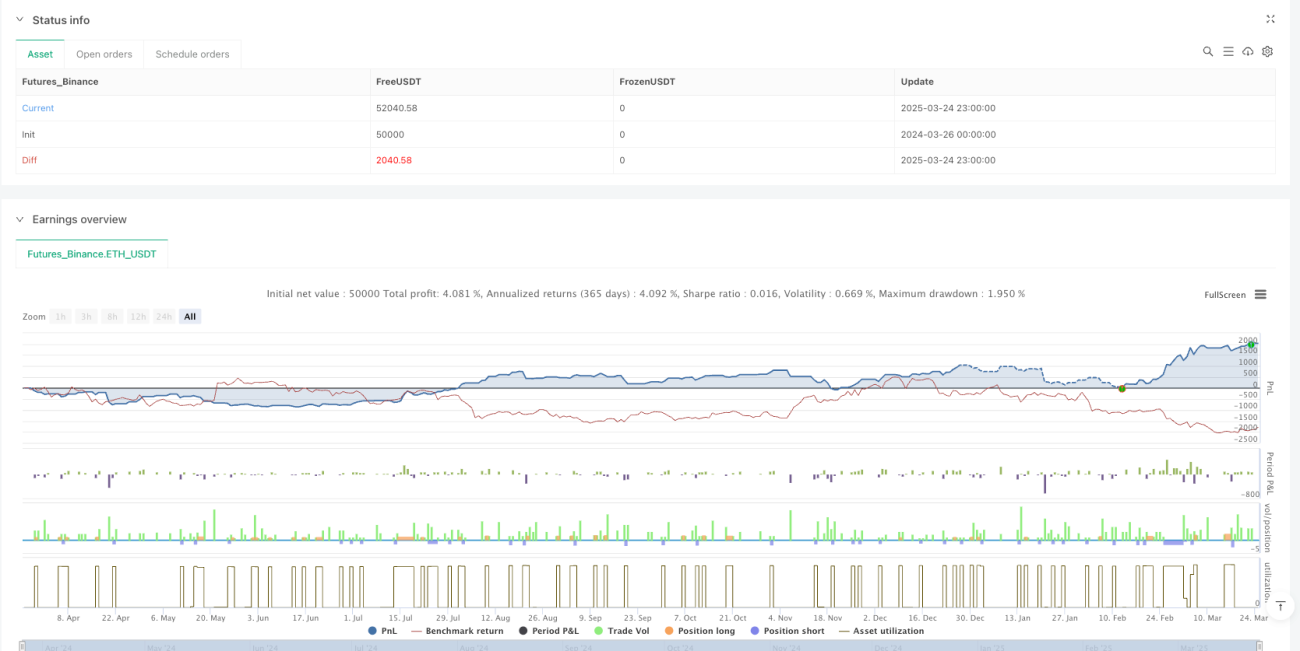
Strategy source code
/*backtest
start: 2024-03-26 00:00:00
end: 2025-03-25 00:00:00
period: 1h
basePeriod: 1h
exchanges: [{"eid":"Futures_Binance","currency":"ETH_USDT"}]
*/

//@version=6
strategy("FlexATR", overlay=true, initial_capital=100000, currency=currency.USD, 
     default_qty_type=strategy.percent_of_equity, default_qty_value=10, calc_on_every_tick=true)


// =====================
// Determinazione del timeframe
// ---------------------
// "resString" contiene il valore del timeframe (es. "D", "1D", "30", "60", "240", "5", "W", "1W", ecc.)
// "res_minutes" è il numero di minuti per barra; gestiamo anche i casi per D, W e M.
resString = timeframe.period
var float res_minutes = na
if resString == "D" or resString == "1D"
    res_minutes := 1440.0
else if resString == "W" or resString == "1W"
    res_minutes := 10080.0
else if resString == "M" or resString == "1M"
    res_minutes := 43200.0
else
    res_minutes := nz(str.tonumber(resString), 1)  // ad es. "30", "60", "240", "5", ecc.

// Se il grafico è intraday (minuti/barra < 1440)
intraday = res_minutes < 1440.0
// Calcolo del numero di barre in un giorno (utile per convertire "giorni" in barre)
barsPerDay = intraday ? (1440.0 / res_minutes) : 1.0

// =====================
// INPUT PARAMETRI MODIFICABILI VIA FORM PER OGNI TIMEFRAME
// =====================

// [Daily Parameters]
fastDays_Daily = input.float(8.0,  title="EMA Veloce (giorni)",  group="Daily Parameters")
slowDays_Daily = input.float(21.0, title="EMA Lenta (giorni)",  group="Daily Parameters")
rsiDays_Daily  = input.float(14.0, title="RSI (giorni)",         group="Daily Parameters")
atrDays_Daily  = input.float(14.0, title="ATR Period (giorni)",  group="Daily Parameters")

// [Weekly Parameters]
fastDays_Weekly = input.float(40.0,  title="EMA Veloce (giorni)",  group="Weekly Parameters")
slowDays_Weekly = input.float(105.0, title="EMA Lenta (giorni)",  group="Weekly Parameters")
rsiDays_Weekly  = input.float(14.0,  title="RSI (giorni)",         group="Weekly Parameters")
atrDays_Weekly  = input.float(14.0,  title="ATR Period (giorni)",  group="Weekly Parameters")

// [30m Parameters] – MODIFICATI per maggiore reattività:
// EMA veloce ridotta da 0.4 a 0.35; EMA lenta da 1.0 a 0.9; RSI e ATR da 0.5 a 0.45.
fastDays_30m = input.float(0.35, title="EMA Veloce (giorni)", group="30m Parameters")
slowDays_30m = input.float(0.9,  title="EMA Lenta (giorni)",  group="30m Parameters")
rsiDays_30m  = input.float(0.45, title="RSI (giorni)",         group="30m Parameters")
atrDays_30m  = input.float(0.45, title="ATR Period (giorni)",  group="30m Parameters")

// [60m Parameters]
fastDays_60m = input.float(0.6, title="EMA Veloce (giorni)", group="60m Parameters")
slowDays_60m = input.float(1.6, title="EMA Lenta (giorni)",  group="60m Parameters")
rsiDays_60m  = input.float(0.6, title="RSI (giorni)",         group="60m Parameters")
atrDays_60m  = input.float(0.6, title="ATR Period (giorni)",  group="60m Parameters")

// [4h Parameters]
fastDays_4h = input.float(1.3, title="EMA Veloce (giorni)", group="4h Parameters")
slowDays_4h = input.float(3.5, title="EMA Lenta (giorni)",  group="4h Parameters")
rsiDays_4h  = input.float(1.3, title="RSI (giorni)",         group="4h Parameters")
atrDays_4h  = input.float(1.3, title="ATR Period (giorni)",  group="4h Parameters")

// [5m Parameters]
fastDays_5m = input.float(0.15, title="EMA Veloce (giorni)", group="5m Parameters")
slowDays_5m = input.float(0.45, title="EMA Lenta (giorni)",  group="5m Parameters")
rsiDays_5m  = input.float(0.15, title="RSI (giorni)",         group="5m Parameters")
atrDays_5m  = input.float(0.15, title="ATR Period (giorni)",  group="5m Parameters")

// =====================
// SELEZIONE DEI PARAMETRI IN BASE AL TIMEFRAME CORRENTE
// Se il timeframe corrente non corrisponde a nessuna categoria, uso i parametri Daily.
fastDays = (resString=="D" or resString=="1D")      ? fastDays_Daily  : 
           (resString=="W" or resString=="1W")      ? fastDays_Weekly : 
           (resString=="30")                        ? fastDays_30m    : 
           (resString=="60")                        ? fastDays_60m    : 
           (resString=="240")                       ? fastDays_4h     : 
           (resString=="5")                         ? fastDays_5m     : fastDays_Daily

slowDays = (resString=="D" or resString=="1D")      ? slowDays_Daily  : 
           (resString=="W" or resString=="1W")      ? slowDays_Weekly : 
           (resString=="30")                        ? slowDays_30m    : 
           (resString=="60")                        ? slowDays_60m    : 
           (resString=="240")                       ? slowDays_4h     : 
           (resString=="5")                         ? slowDays_5m     : slowDays_Daily

rsiDays  = (resString=="D" or resString=="1D")      ? rsiDays_Daily   : 
           (resString=="W" or resString=="1W")      ? rsiDays_Weekly  : 
           (resString=="30")                        ? rsiDays_30m     : 
           (resString=="60")                        ? rsiDays_60m     : 
           (resString=="240")                       ? rsiDays_4h      : 
           (resString=="5")                         ? rsiDays_5m      : rsiDays_Daily

atrDays  = (resString=="D" or resString=="1D")      ? atrDays_Daily   : 
           (resString=="W" or resString=="1W")      ? atrDays_Weekly  : 
           (resString=="30")                        ? atrDays_30m     : 
           (resString=="60")                        ? atrDays_60m     : 
           (resString=="240")                       ? atrDays_4h      : 
           (resString=="5")                         ? atrDays_5m      : atrDays_Daily

// =====================
// Conversione dei periodi (espresso in "giorni") in numero di barre
fastPeriod = intraday ? math.round(fastDays * barsPerDay) : math.round(fastDays)
slowPeriod = intraday ? math.round(slowDays * barsPerDay) : math.round(slowDays)
rsiPeriod  = intraday ? math.round(rsiDays * barsPerDay)  : math.round(rsiDays)
atrPeriod  = intraday ? math.round(atrDays * barsPerDay)  : math.round(atrDays)

// =====================
// Definizione dei colori "color-blind friendly" (palette Okabe-Ito)
// EMA Veloce: Blu (RGB 0,114,178)
// EMA Lenta: Arancione (RGB 230,159,0)
// Stop Loss: Vermilion (RGB 213,94,0)
// Profit Target: Azzurro (RGB 86,180,233)
emaFastColor = color.rgb(0,114,178)
emaSlowColor = color.rgb(230,159,0)
stopColor    = color.rgb(213,94,0)
targetColor  = color.rgb(86,180,233)

// =====================
// Calcolo degli indicatori
emaFast  = ta.ema(close, fastPeriod)
emaSlow  = ta.ema(close, slowPeriod)
rsiValue = ta.rsi(close, rsiPeriod)
atrValue = ta.atr(atrPeriod)

// =====================
// Input per la gestione del rischio (modificabili via form)
atrStopMult   = input.float(3.0, title="Moltiplicatore ATR per Stop Loss", step=0.1)
atrProfitMult = input.float(1.5, title="Moltiplicatore ATR per Profit Target", step=0.1)

// NUOVO: Abilitazione del Trailing Stop Dinamico
enableTrailingStop = input.bool(true, title="Abilita Trailing Stop Dinamico")
atrTrailMult       = input.float(1.0, title="Moltiplicatore ATR per Trailing Stop", step=0.1)

// =====================
// Condizioni di ingresso
// Long: quando l'EMA veloce incrocia al rialzo quella lenta e l'RSI è > 50
longCondition = ta.crossover(emaFast, emaSlow) and (rsiValue > 50)
// Short: quando l'EMA veloce incrocia al ribasso quella lenta e l'RSI è < 50
shortCondition = ta.crossunder(emaFast, emaSlow) and (rsiValue < 50)

// Calcolo dei livelli fissi di stop loss e profit target basati sull'ATR
longStop   = close - atrValue * atrStopMult
longTarget = close + atrValue * atrProfitMult
shortStop  = close + atrValue * atrStopMult
shortTarget= close - atrValue * atrProfitMult

// =====================
// Plot degli indicatori
plot(emaFast, title="EMA Veloce", color=emaFastColor)
plot(emaSlow, title="EMA Lenta", color=emaSlowColor)
hline(50, title="RSI 50", color=color.gray, linestyle=hline.style_dotted)
plot(rsiValue, title="RSI", color=color.blue, display=display.none)

// =====================
// Logica degli ingressi e gestione delle posizioni (attiva solo se time >= startDate)

if (longCondition)
    strategy.entry("Long", strategy.long)
if (shortCondition)
    strategy.entry("Short", strategy.short)
    
// Per le uscite, se il trailing stop dinamico è abilitato, lo usiamo; altrimenti l'uscita fissa
if (strategy.position_size > 0)
    if (enableTrailingStop)
        strategy.exit("Exit Long", from_entry="Long", trail_offset=atrValue * atrTrailMult, limit=longTarget)
    else
        strategy.exit("Exit Long", from_entry="Long", stop=longStop, limit=longTarget)
        
if (strategy.position_size < 0)
    if (enableTrailingStop)
        strategy.exit("Exit Short", from_entry="Short", trail_offset=atrValue * atrTrailMult, limit=shortTarget)
    else
        strategy.exit("Exit Short", from_entry="Short", stop=shortStop, limit=shortTarget)

// =====================
// Plot dei livelli di Stop Loss e Profit Target quando in posizione
plot(strategy.position_size > 0 ? longStop   : na, title="Stop Loss",   style=plot.style_linebr, color=stopColor)
plot(strategy.position_size > 0 ? longTarget : na, title="Profit Target", style=plot.style_linebr, color=targetColor)
plot(strategy.position_size < 0 ? shortStop  : na, title="Stop Loss",   style=plot.style_linebr, color=stopColor)
plot(strategy.position_size < 0 ? shortTarget: na, title="Profit Target", style=plot.style_linebr, color=targetColor)