Overview
The Multi-Indicator Volatility Breakout Trading System Based on Volume-Price Relationship is a comprehensive quantitative trading strategy that combines volume spike detection, ATR volatility channels, and RSI momentum filtering. The core concept of this strategy is to capture instances of sudden volume surges in the market, viewing them as potential trading opportunities, while incorporating price dynamics and technical indicators for multi-level filtering to enhance the precision of trading decisions. The strategy utilizes ATR volatility channels as references for stop-loss and take-profit levels, and leverages the RSI indicator to avoid excessive buying or selling, creating a complete trading system framework.
Strategy Principles
The operation of this strategy is based on the following key modules:
Volume Spike Detection: The strategy first defines the “VolSpike” concept by comparing the current volume with the total volume of the previous N candles. When the current candle’s volume exceeds the sum of the previous N candles, it is identified as a volume spike signal. This abnormal trading volume typically indicates a potential directional change in the market.
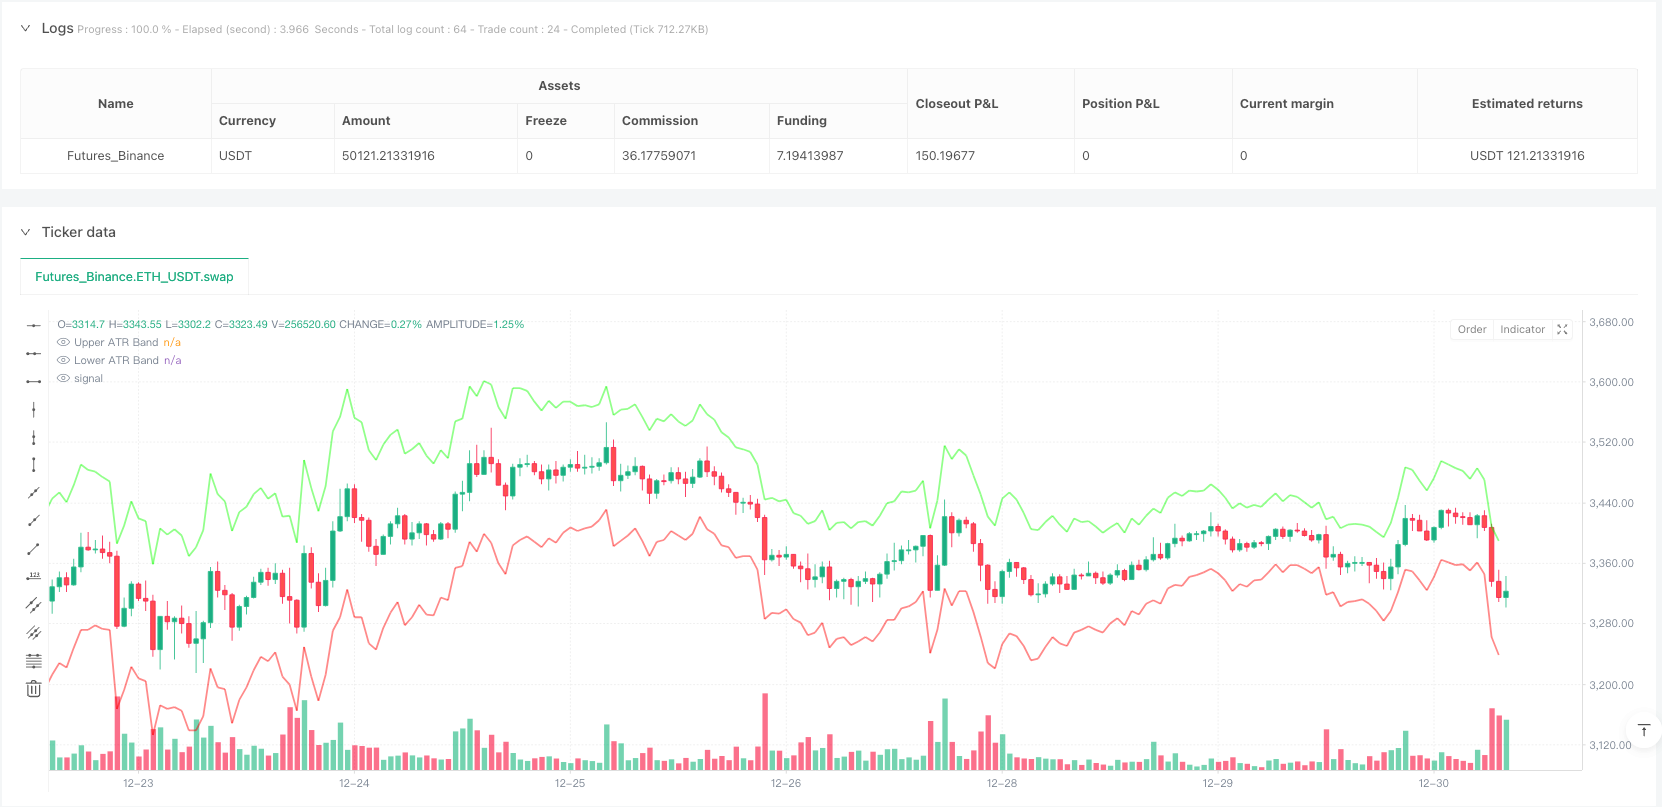
ATR Volatility Channels: The strategy calculates the Average True Range (ATR) and creates upper and lower bands as reference ranges for price volatility. These channels not only serve to visualize market volatility but are also directly used to set stop-loss positions. The ATR channel calculation employs user-adjustable periods and multipliers, allowing the strategy to adapt to different market environments.
RSI Momentum Filtering: Trading signals are filtered through the Relative Strength Index (RSI) to avoid trading during extreme overbought or oversold conditions. Users can set upper and lower threshold values for RSI, and the strategy will only consider opening positions when the RSI value is between these thresholds.
Candlestick Pattern Analysis: The strategy also incorporates candlestick pattern analysis by measuring the ratio of the candlestick body to its upper and lower shadows, filtering out signals from candles with excessively long shadows, which helps avoid entering markets that might quickly reverse.
Trade Execution Logic:
- When a volume spike is detected and the RSI filtering conditions and candlestick pattern requirements are met, the strategy will determine the entry direction based on the position of the closing price relative to the opening price.
- Long condition: Closing price greater than opening price (bullish candle) and the upper shadow does not exceed the maximum set ratio.
- Short condition: Closing price less than opening price (bearish candle) and the lower shadow does not exceed the maximum set ratio.
- Stop-loss positions are set at the boundaries of the ATR channel, while take-profit positions are based on the distance between the entry price and the ATR channel, multiplied by a user-defined multiplier.
Strategy Advantages
Multi-dimensional Signal Confirmation: By combining volume, price patterns, and technical indicators through multiple condition filtering, the strategy significantly improves the quality of trading signals and reduces false signals.
Strong Adaptability: Key parameters such as ATR period, RSI thresholds, and volume comparison baseline are all adjustable, allowing the strategy to adapt to different market environments and trading instruments.
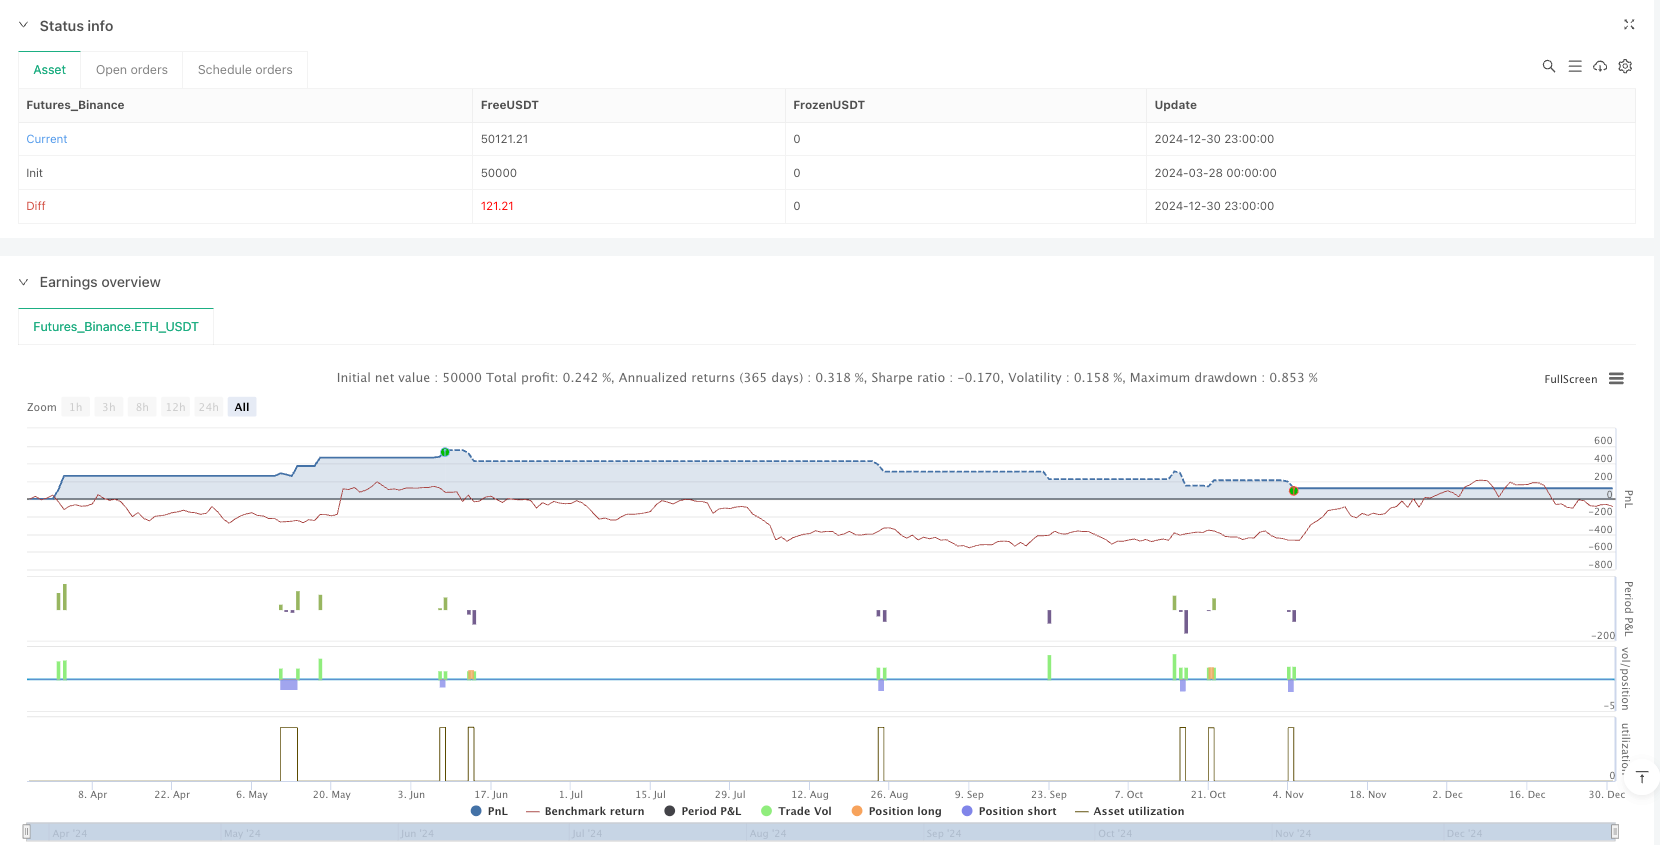
Comprehensive Risk Management: Each trade has clear stop-loss and take-profit settings that dynamically adjust based on market volatility (ATR), which is more reasonable than fixed point or percentage-based risk management.
Visual Trading Signals: The strategy displays ATR channels and volume spike signals (rocket icon) intuitively on the chart, making it easy for traders to understand market conditions and strategy logic.
Refined Entry Filtering: By analyzing the ratio of candlestick shadows to bodies, the strategy avoids opening positions on highly volatile candles, which helps improve the success rate of trades.
Strategy Risks
Reversal Risk: Despite using multiple filtering mechanisms, the market may still quickly reverse after a volume spike, especially during major news events or market manipulation. To reduce this risk, consider adding time filters to avoid trading before and after important economic data releases.
Parameter Optimization Trap: The strategy includes multiple adjustable parameters, and excessive optimization may lead to overfitting, causing the strategy to perform poorly in live trading. It is recommended to use forward testing or test parameter robustness across multiple trading instruments.
Liquidity Risk: Volume spike strategies may produce misleading signals in low liquidity markets. Ensure application in markets with sufficient liquidity and consider adding minimum volume thresholds as additional filtering conditions.
Systemic Risk Exposure: During severe market volatility or systemic risk events, ATR stops may experience significant slippage. Consider setting maximum loss limits or using more conservative position management strategies to mitigate this risk.
Single Timeframe Limitation: The current strategy operates on a single timeframe and may miss important trend information from larger timeframes. This could lead to counter-trend trading against the main trend direction.
Strategy Optimization Directions
Multi-timeframe Analysis Integration: Incorporating the trend direction of larger timeframes as a filtering condition and only trading in the direction of the main trend can significantly improve the strategy’s success rate. This can be achieved by adding moving averages or trend indicators from larger timeframes.
Dynamic Adjustment of VolSpike Parameters: Automatically adjusting the baseline period for volume comparison based on market volatility, using longer comparison periods in low volatility markets and shorter periods in high volatility markets, to adapt to different market conditions.
Machine Learning Optimization of Signal Quality: Analyzing the relationship between historical volume spike patterns and subsequent price movements through machine learning algorithms to further refine signal quality assessment and only execute signals with a high probability of success.
Incorporation of Market Sentiment Indicators: Integrating volatility indices like VIX or market breadth indicators to adjust or pause the strategy in extreme market environments, avoiding trading in highly uncertain conditions.
Implementation of Dynamic Take-Profit Strategies: When prices move in a favorable direction, consider implementing trailing stops or staged profit-taking strategies to maximize profit potential and protect realized profits.
Optimization of Capital Management Module: The current strategy uses a fixed proportion for position management, but could consider dynamic position management based on volatility or the Kelly formula to automatically adjust risk exposure under different market conditions.
Summary
The Multi-Indicator Volatility Breakout Trading System Based on Volume-Price Relationship is a well-structured quantitative trading strategy that builds a multi-level trading decision framework by combining volume spike detection, ATR volatility channels, and RSI momentum filtering. The core advantages of the strategy lie in its comprehensive signal confirmation mechanism and well-established risk management system, enabling it to capture market opportunities while controlling risk.
However, every trading strategy has limitations. The main risks of this strategy include market reversal risk, parameter optimization traps, and single timeframe limitations. The strategy has significant room for improvement through integrating multi-timeframe analysis, dynamically adjusting parameters, introducing machine learning, and optimizing capital management.
For quantitative traders pursuing systematic trading, this strategy provides a solid foundational framework that can be further customized and optimized according to individual preferences and market characteristics. Ultimately, the success of the strategy depends on the trader’s understanding of the market and grasp of the strategy logic, as well as strict disciplinary execution and continuous strategy improvement.
/*backtest
start: 2024-03-28 00:00:00
end: 2024-12-31 00:00:00
period: 1h
basePeriod: 1h
exchanges: [{"eid":"Futures_Binance","currency":"ETH_USDT"}]
*/

//@version=5
strategy("VolSpike ATR RSI Strategy with ATR Bands", overlay=true, initial_capital=10000, default_qty_type=strategy.percent_of_equity, default_qty_value=10, calc_on_every_tick=false)

//────────────────────────────
// ① User Inputs
//────────────────────────────
// VolSpike reference candle count
barsBack = input.int(7, title="VolSpike - Reference Candle Count", minval=1)

// ATR Band related input values
atrPeriod     = input.int(title="ATR Period", defval=14, minval=1)
atrMultiplier = input.float(title="ATR Band Scale Factor", defval=2.5, step=0.1, minval=0.01)

// RSI related input values and thresholds
rsiPeriod = input.int(title="RSI Period", defval=14, minval=1)
rsiUpper  = input.int(title="RSI Upper Threshold", defval=80, minval=50, maxval=100)
rsiLower  = input.int(title="RSI Lower Threshold", defval=20, minval=0,  maxval=50)

// TP multiplier input: default 1 multiplier (TP = entry price + N times ATR band difference)
tpMultiplier = input.float(title="TP Multiplier", defval=1.0, step=0.1, minval=0.1, tooltip="Determines how many times the difference between the entry price and ATR band is used for TP.")

// Candle wick filter: Maximum allowed wick ratio (body to wick)
maxWickRatio = input.float(title="Max Allowed Wick Ratio", defval=2.0, minval=0.1, step=0.1, tooltip="If the wick length is greater than this ratio compared to the body, no entry will be made.")

//────────────────────────────
// ② VolSpike Calculation (Based on candle close)
//────────────────────────────
var float volSum = na
if bar_index > barsBack
    volSum := 0.0
    for i = 1 to barsBack
        volSum += volume[i]
else
    volSum := na
volSpike = not na(volSum) and (volume > volSum)

//────────────────────────────
// ③ RSI Calculation and Filter (Using user-set RSI thresholds)
//────────────────────────────
rsiVal    = ta.rsi(close, rsiPeriod)
rsiFilter = (rsiVal < rsiUpper) and (rsiVal > rsiLower)

//────────────────────────────
// ⑤ ATR Band Calculation
//────────────────────────────
getBandOffsetSource(srcIn, isUpperBand) =>
    ret = close
    switch srcIn
        "close" => ret := close
        "wicks" => ret := isUpperBand ? high : low
        => ret := close
    ret

// Offset reference is fixed to 'close'
atrSourceRef  = "close"
atrValue      = ta.atr(atrPeriod)
scaledATR     = atrValue * atrMultiplier
upperATRBand  = getBandOffsetSource(atrSourceRef, true)  + scaledATR
lowerATRBand  = getBandOffsetSource(atrSourceRef, false) - scaledATR

// Plot ATR bands on the chart
plot(upperATRBand, title="Upper ATR Band", color=color.rgb(0,255,0,50), linewidth=2)
plot(lowerATRBand, title="Lower ATR Band", color=color.rgb(255,0,0,50), linewidth=2)

//────────────────────────────
// ⑥ Rocket Signal (VolSpike) Display
//────────────────────────────
plotshape(volSpike, title="VolSpike Rocket", location=location.belowbar, style=shape.labelup, text="🚀", color=color.blue, size=size.tiny)

//────────────────────────────
// ⑦ Candle Wick Length Filter Calculation (Applied in reverse)
//────────────────────────────
// Body length (absolute value)
bodyLength = math.abs(close - open)
bodyLength := bodyLength == 0 ? 0.0001 : bodyLength  // Prevent doji
// Long position entry upper wick ratio: (high - close) / bodyLength
longWickRatio = (high - close) / bodyLength
// Short position entry lower wick ratio: (close - low) / bodyLength
shortWickRatio = (close - low) / bodyLength

longWickOK = longWickRatio <= maxWickRatio
shortWickOK = shortWickRatio <= maxWickRatio

//────────────────────────────
// ⑧ Position Entry and Exit Setup
//    - Long: Close of the entry candle > Open → SL = lowerATRBand, TP = entry price + tpMultiplier * (upperATRBand - entry price)
//    - Short: Close of the entry candle < Open → SL = upperATRBand, TP = entry price - tpMultiplier * (entry price - lowerATRBand)
//────────────────────────────
if volSpike and rsiFilter
    // Long position entry (bullish candle) && wick condition met (upper wick)
    if close > open and longWickOK
        longTP = close + tpMultiplier * (upperATRBand - close)
        strategy.entry("Long", strategy.long)
        strategy.exit("Exit Long", from_entry="Long", stop=lowerATRBand, limit=longTP)
    // Short position entry (bearish candle) && wick condition met (lower wick)
    else if close < open and shortWickOK
        shortTP = close - tpMultiplier * (close - lowerATRBand)
        strategy.entry("Short", strategy.short)
        strategy.exit("Exit Short", from_entry="Short", stop=upperATRBand, limit=shortTP)