Three-Minute Breakthrough Quantitative Strategy: Multi-Timeframe RSI Momentum Breakout Trading System

Overview
This quantitative strategy is a multi-timeframe breakout trading system developed using Pine Script v5, combining the analytical advantages of 3-minute and 1-minute timeframes. The core approach involves identifying key price peaks (swing highs) and dips (swing lows) on the 3-minute chart, and executing trades on the 1-minute chart after momentum confirmation. The strategy employs a 60-period Exponential Moving Average (EMA) as the primary trend indicator and uses the Relative Strength Index (RSI) to provide momentum confirmation signals, forming a comprehensive trading system that combines trend following with breakout principles.
Strategy Principles
The trading logic of this strategy is divided into three key components: peak detection, dip confirmation, and entry conditions.
First, the system obtains 3-minute period price data through the request.security function and calculates a 60-period EMA. Peak detection employs a multi-condition verification mechanism where a price bar must be above the EMA, and its high must exceed the highs of surrounding bars (comparing 2, 3, 4 periods back and 1 period forward). This design ensures the capture of genuine local highs.
Second, dip detection uses a consecutive declining bar counting method. When the price falls below the EMA and exhibits at least 3 consecutive declining bars, the system records the lowest point during this period as the dip. This method effectively identifies bottom areas of short-term corrections.
Finally, entry conditions are confirmed on the 1-minute chart, including: closing price higher than opening price (bullish candle), price breaking above the previously identified peak, 180-period EMA (corresponding to the 60-period EMA on the 3-minute chart) sloping upward, and RSI above its 9-period average and in an uptrend. Only when all these conditions are simultaneously met does the system generate a buy signal. The strategy uses the dip level as a stop-loss, automatically closing positions when the price falls below this level.
Strategy Advantages
This quantitative breakout strategy offers several significant advantages:
-
Multi-timeframe Analysis Framework: Combining 3-minute and 1-minute timeframes allows for capturing larger trends while enabling precise entries, reducing false breakout risks. This design balances signal quality with response speed.
-
Comprehensive Entry Confirmation Mechanism: Rather than relying solely on price breakouts, it incorporates EMA trend direction and RSI momentum indicators for multiple confirmations, significantly reducing the possibility of false breakout trades.
-
Clear Risk Management: Using identified dips as stop-loss points establishes clear risk boundaries for each trade, helping to control single-trade losses.
-
Dynamic Adaptation to Market Conditions: By identifying peaks and dips in real-time, the strategy can self-adapt to different market volatility conditions without relying on fixed parameter adjustments.
-
Trend and Momentum Combination: The strategy determines overall trend direction through EMA while confirming price momentum with RSI, avoiding erroneous trades during trendless periods or when trends are weakening.
Strategy Risks
Despite its well-designed structure, the strategy carries the following potential risks:
-
Timeframe Dependency: Strategy performance is highly dependent on the selected timeframes (3-minute and 1-minute). In different market environments, these timeframes may no longer be optimal, leading to decreased strategy performance.
-
Rapid Fluctuation Market Risk: In highly volatile markets, prices may quickly break through peaks and then rapidly retrace, triggering entry signals that ultimately result in losses.
-
Stop-Loss Positioning Risk: Using dips as stop-losses may result in excessively wide stop levels, increasing potential losses on individual trades. This risk is particularly significant in markets with extreme volatility.
-
Consecutive Signal Accumulation: Strong trending markets may generate multiple consecutive entry signals, potentially leading to overtrading and improper capital allocation if position management mechanisms are absent.
-
Parameter Sensitivity: The choice of 60-period EMA and RSI parameters (14,9) may not be suitable for all market environments, and improper parameter adjustment could lead to significant fluctuations in strategy performance.
Solutions to these risks include: implementing adaptive parameter adjustment mechanisms, adding filters to reduce trading in weak markets, implementing fixed percentage stop-losses instead of dip-based stops, introducing position management systems, and setting daily maximum trade limits.
Optimization Directions
The strategy presents several worthwhile optimization opportunities:
-
Adaptive Parameter System: The current strategy uses fixed 60-period EMA and RSI(14,9) parameters. A viable optimization would be to introduce a volatility-based adaptive parameter adjustment mechanism, such as using longer-period EMAs in high-volatility markets to reduce noise.
-
Additional Trading Filters: Trading session filters (avoiding low-liquidity periods), market type identification (distinguishing between trending/ranging markets), and volume confirmation could be added to improve signal quality.
-
Improved Stop-Loss Strategy: The current dip-based stop-loss may be either too wide or too narrow. Consider incorporating ATR (Average True Range) for dynamic stop-loss setting, or using trailing stops to better protect profits.
-
Profit Target Implementation: The strategy currently has stop-losses but no profit-taking mechanism. Risk-reward ratios could be established based on the distance between peaks and dips, or dynamic profit targets such as multiples of ATR over the previous N fluctuations could be used.
-
Position Sizing System Integration: Dynamically adjust trade size based on signal strength (such as RSI reading intensity, breakout magnitude) and market volatility to better manage capital risk.
Implementing these optimizations would not only enhance the strategy's existing effectiveness but also make it more adaptable to different market environments, improving overall robustness and long-term profitability.
Summary
The Three-Minute Breakthrough Quantitative Strategy is an elegantly designed multi-timeframe trading system that creates a trading method capable of both capturing trends and executing precise entries by combining medium-term (3-minute) trend analysis with short-term (1-minute) momentum confirmation. The strategy's core strengths lie in its multi-level confirmation mechanism and clear risk management framework, effectively reducing the possibility of false breakout trades.
The strategy's limitations primarily center on parameter fixity and stop-loss mechanism flexibility, but these issues can be addressed through adaptive parameter systems, improved risk management methods, and more comprehensive market filters. With these optimizations, the strategy has the potential to evolve into a trading system with stronger adaptability and more refined risk management.
For traders looking to capture breakout opportunities in short-term markets, this strategy provides a structured framework, but it's important to note the necessity of parameter adjustments and strategy optimizations based on specific trading instruments and market environments to achieve optimal trading results.
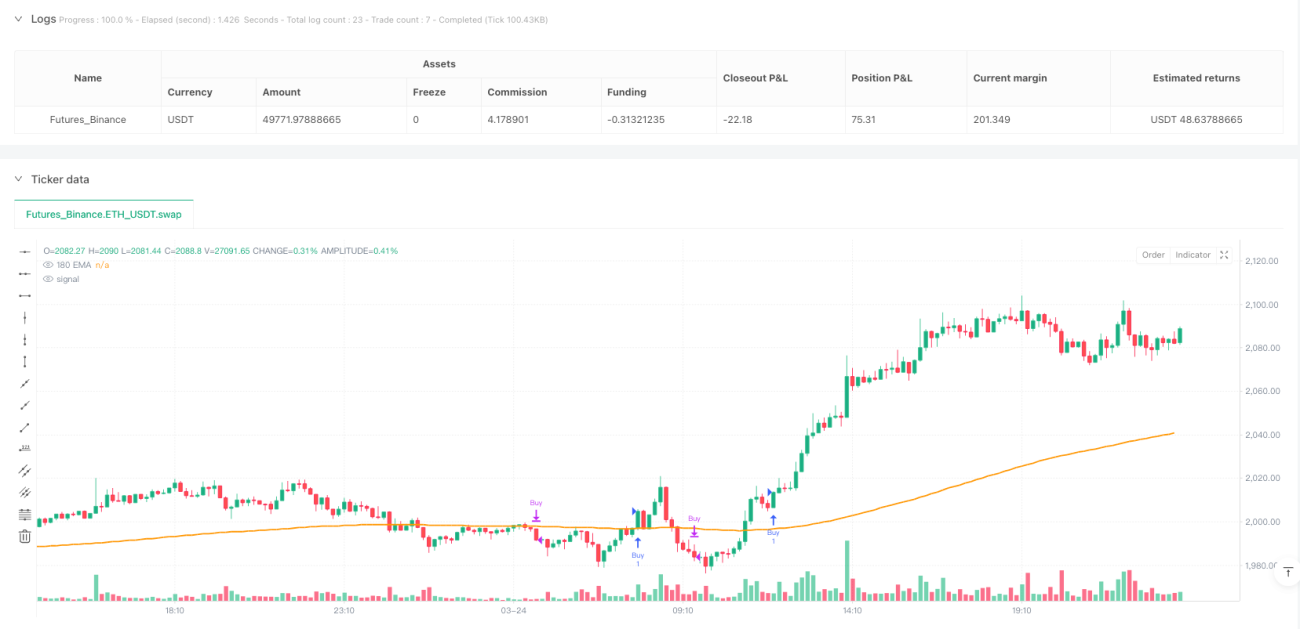
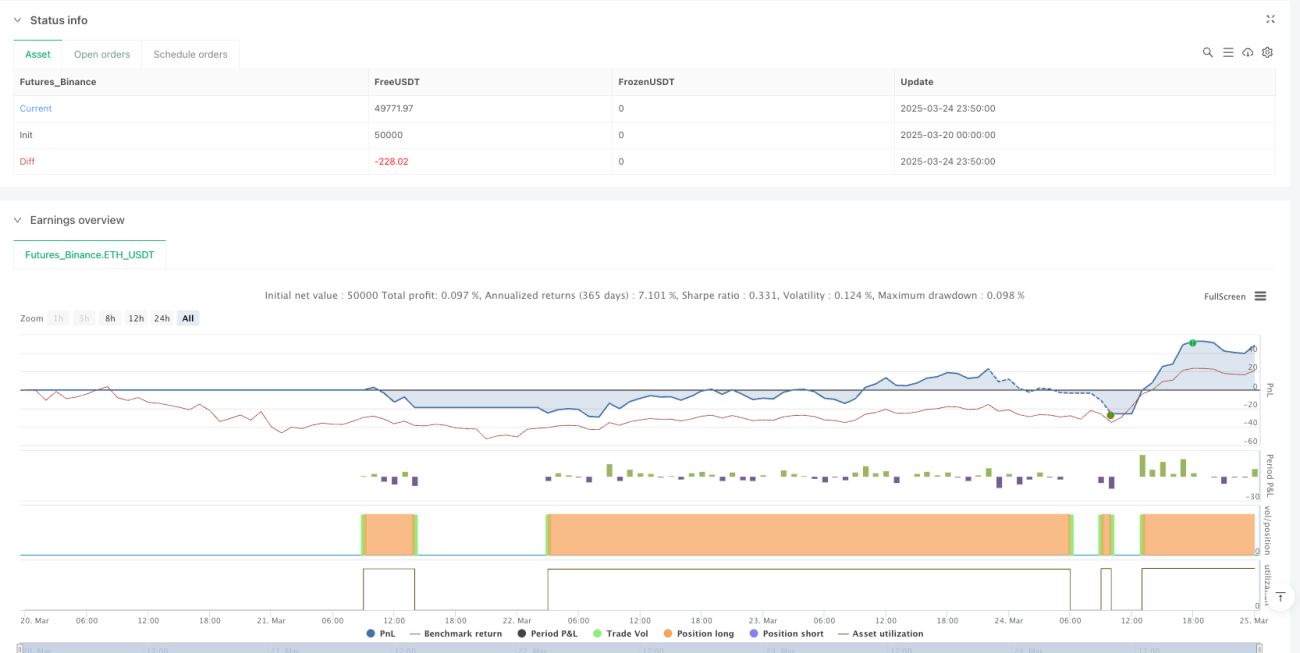
/*backtest
start: 2025-03-20 00:00:00
end: 2025-03-25 00:00:00
period: 10m
basePeriod: 10m
exchanges: [{"eid":"Futures_Binance","currency":"ETH_USDT"}]
*/

// This Pine Script™ code is subject to the terms of the Mozilla Public License 2.0 at https://mozilla.org/MPL/2.0/
// © adamkiil79
//@version=5
//@version=5- 1