
Overview
This strategy is a quantitative trading method that comprehensively utilizes multiple technical indicators, aiming to precisely capture market trends and achieve controllable trading risks by combining Exponential Moving Averages (EMA), Relative Strength Index (RSI), Average True Range (ATR), Volume Weighted Average Price (VWAP), and Supertrend indicators.
Strategy Principles
The core principle is based on the synergistic effect of multi-dimensional technical indicators:
- Use 50-day and 200-day Exponential Moving Averages (EMA) to determine trend direction and potential trend reversal points
- Confirm trend momentum and avoid excessive chasing through the Relative Strength Index (RSI)
- Calculate dynamic stop-loss and take-profit distances using Average True Range (ATR)
- Verify price trend support and resistance levels with Volume Weighted Average Price (VWAP)
- Use Supertrend indicator to confirm trend direction and trading signals
Strategy Advantages
- Multi-indicator Collaboration: Significantly improve signal accuracy and reliability by integrating multiple technical indicators
- Risk Management: Dynamic ATR stop-loss and fixed risk-reward ratio effectively control single trade risk
- High Flexibility: Parameters can be adjusted according to market changes, adapting to different market environments
- Signal Filtering: Reduce erroneous trades by filtering uncertain signals through RSI and VWAP indicators
- Real-time Performance: Generate real-time trading signals and alerts for quick market response
Strategy Risks
- Parameter Sensitivity: Improper indicator parameter settings may lead to frequent or missing trading signals
- Market Black Swan Events: Cannot completely avoid sudden market events and violent fluctuations
- Overfitting Risk: Requires thorough backtesting and verification of strategy parameters
- Trading Costs: Frequent trading may increase commission and slippage costs
- Indicator Failure: Some technical indicators may lose predictive power in certain market phases
Strategy Optimization Directions
- Introduce Machine Learning Algorithms: Use AI technology to dynamically adjust indicator parameters
- Add More Filtering Conditions: Introduce additional indicators like volatility and trading volume
- Develop Multi-cycle Analysis Module: Verify trading signals across different time scales
- Optimize Risk Management: Introduce more complex position and capital management strategies
- Add Adaptive Parameters: Automatically adjust stop-loss and take-profit strategies based on market volatility
Summary
This is a quantitative trading strategy based on multi-dimensional technical indicators, aimed at capturing market trends and controlling trading risks through systematic indicator combinations and strict risk management. The strategy's core lies in the collaborative effect of indicators and dynamic parameter optimization, providing a flexible and relatively robust approach to quantitative trading.
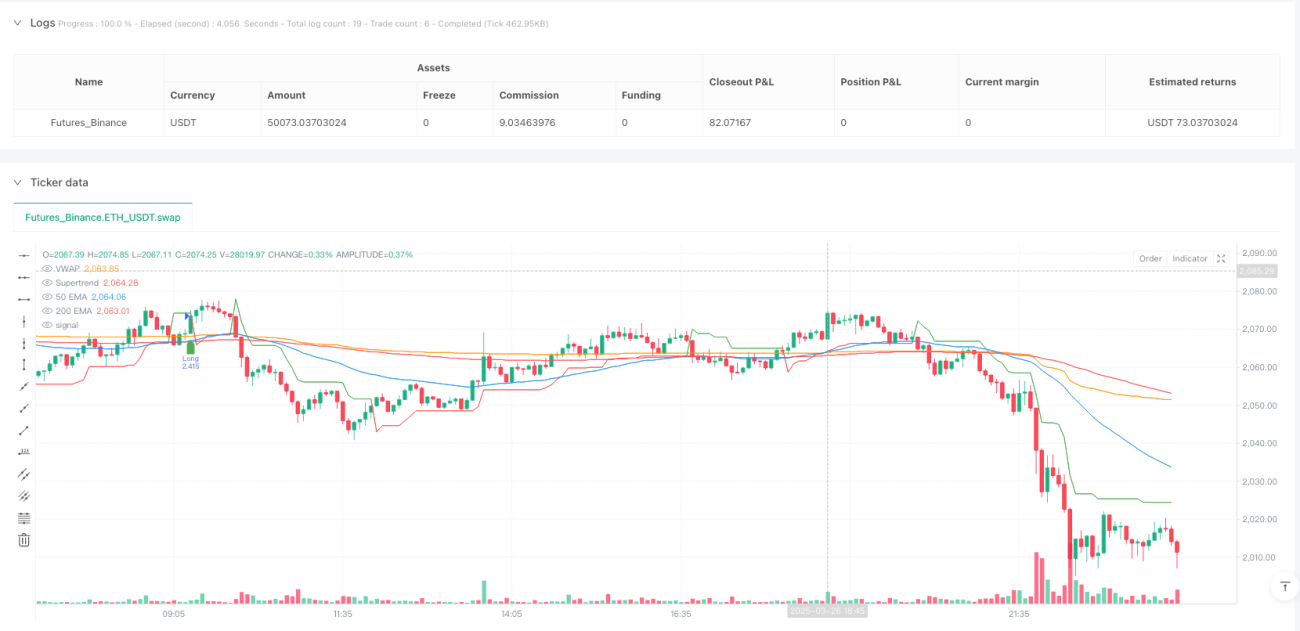
/*backtest
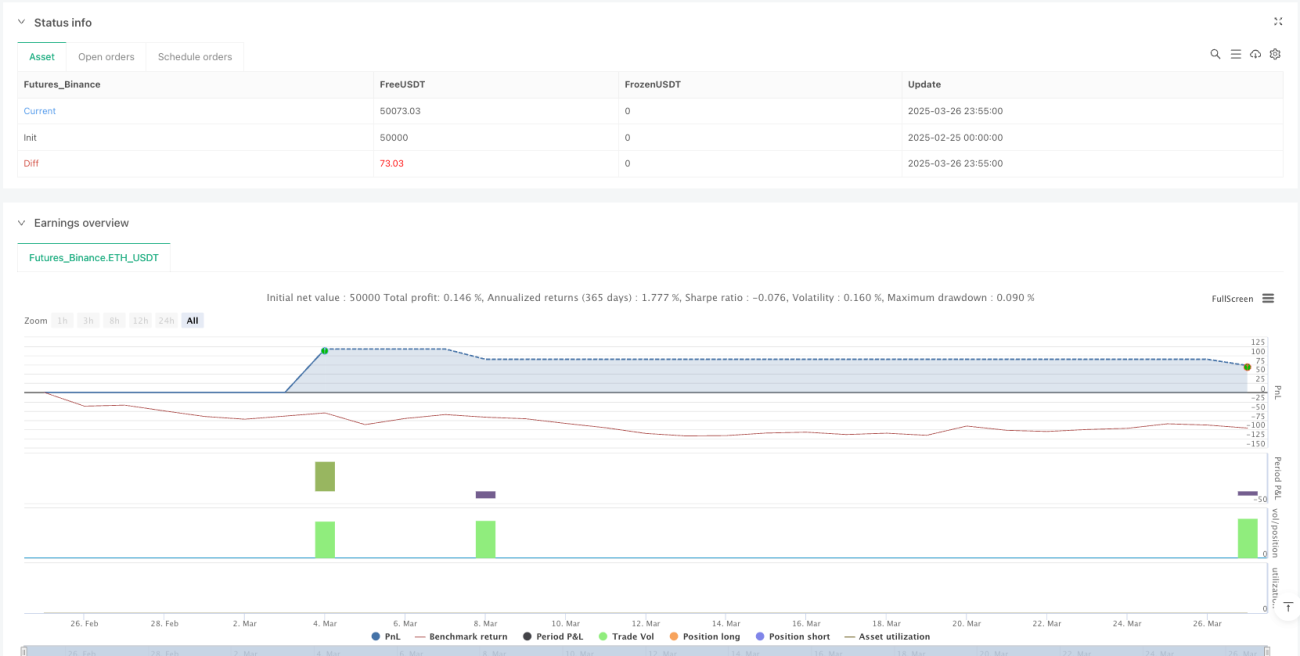
start: 2025-02-25 00:00:00
end: 2025-03-27 00:00:00
period: 5m
basePeriod: 5m
exchanges: [{"eid":"Futures_Binance","currency":"ETH_USDT"}]
*/
//@version=6
strategy("Advanced BTC/USDT Strategy", overlay=true, default_qty_type=strategy.percent_of_equity, default_qty_value=10)
// ==== INPUT PARAMETERS ====- 1