Dynamic Bollinger Bands Breakout Trend Tracking Strategy

BB TP/SL SMA stdev MA
Created on: 2025-03-28 17:24:35 Modified on: 2025-03-28 17:24:35
Copy: 0 Number of hits: 384
avatar of ianzeng123 ianzeng123
2
Follow
319
Followers

 Dynamic Bollinger Bands Breakout Trend Tracking Strategy  Dynamic Bollinger Bands Breakout Trend Tracking Strategy

Overview

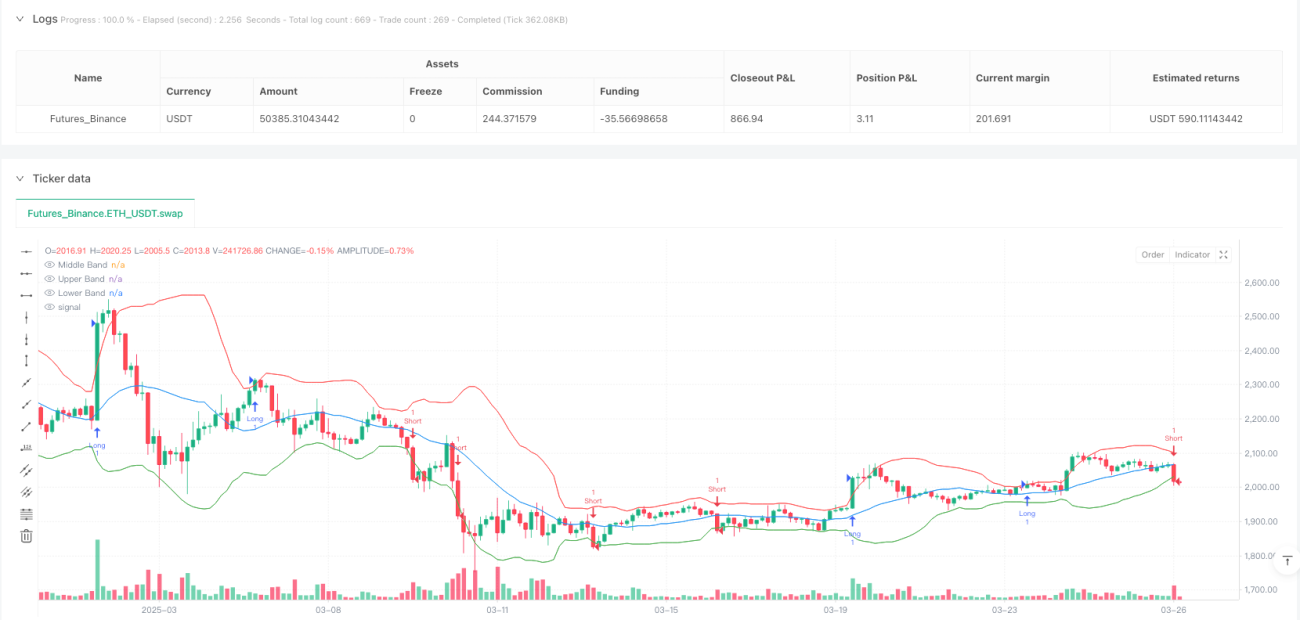
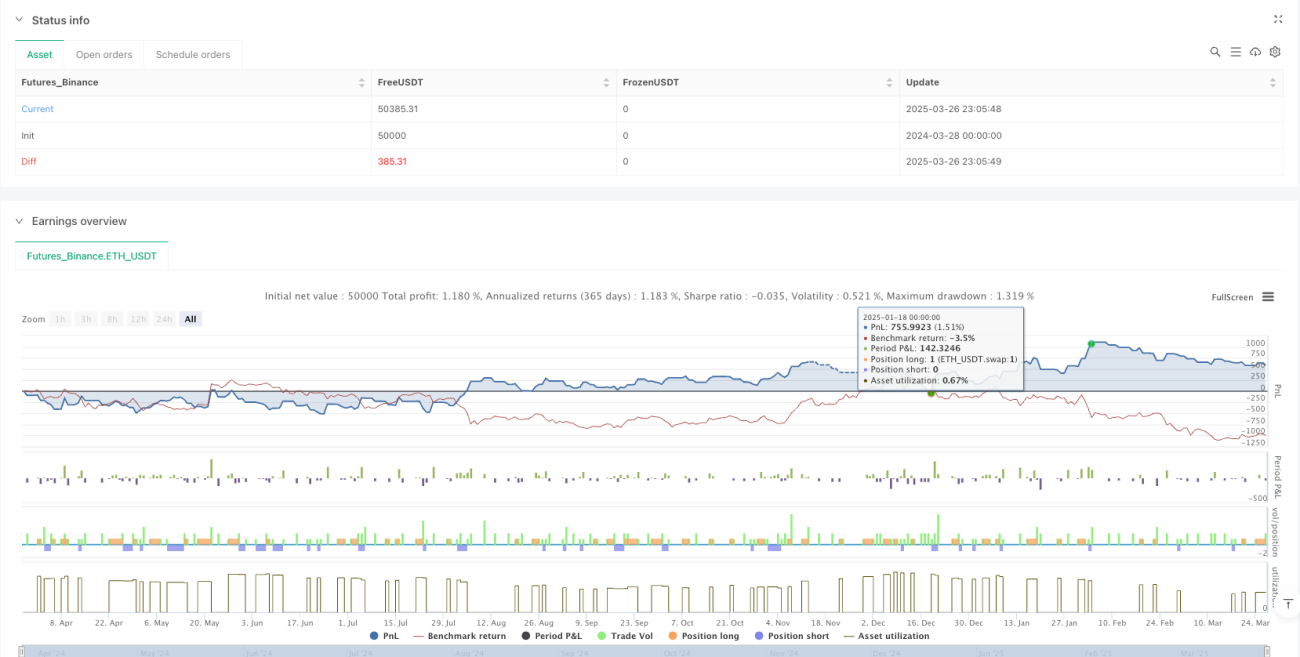
The Dynamic Bollinger Bands Breakout Trend Tracking Strategy is a quantitative trading method based on the Bollinger Bands indicator. By capturing price breakout signals at the boundary of volatility bands, it identifies potential trend trading opportunities. The strategy aims to utilize market volatility and trend momentum, generating trading signals when prices break through upper and lower bands, and effectively managing trading risks through take-profit and stop-loss mechanisms.

Strategy Principles

The core principle is based on dynamic Bollinger Bands calculation and price breakout signals:

  1. Using Simple Moving Average (SMA) as the middle band benchmark
  2. Calculating upper and lower bands through standard deviation (STDEV)
  3. Triggering long signals when closing price breaks above upper band
  4. Triggering short signals when closing price breaks below lower band
  5. Setting fixed percentage take-profit and stop-loss points

Strategy Advantages

  1. Dynamic adaptation to market volatility
  2. Clear entry and exit signals
  3. Visualized trading boundaries
  4. Controllable position management
  5. Suitable for markets with clear trends

Strategy Risks

  1. Potential false signals in range-bound markets
  2. Lagging breakout signals
  3. Fixed percentage take-profit and stop-loss may lack flexibility
  4. Ignoring transaction costs and slippage

Strategy Optimization Directions

  1. Introduce volume filters
  2. Combine trend confirmation indicators
  3. Dynamically adjust take-profit and stop-loss ratios
  4. Incorporate machine learning algorithms for parameter optimization

Summary

The Dynamic Bollinger Bands Breakout Trend Tracking Strategy provides traders with a relatively simple and intuitive quantitative trading method by capturing price volatility band breakout signals. Through continuous optimization and risk management, this strategy can become a powerful addition to the quantitative trading toolbox.

Strategy source code
/*backtest
start: 2024-03-28 00:00:00
end: 2025-03-27 00:00:00
period: 3h
basePeriod: 3h
exchanges: [{"eid":"Futures_Binance","currency":"ETH_USDT"}]
*/

//@version=6
strategy("Bollinger Bands Breakout Strategy", overlay=true)

// Input settings
length = input.int(20, title="BB Length")
src = close
mult = input.float(2.0, title="BB Multiplier")

// Bollinger Bands Calculation
basis = ta.sma(src, length)
dev = mult * ta.stdev(src, length)
upper = basis + dev
lower = basis - dev

// Breakout Conditions
longCondition = ta.crossover(close, upper)
shortCondition = ta.crossunder(close, lower)

// Plotting Bollinger Bands
plot(basis, color=color.blue, title="Middle Band")
plot(upper, color=color.red, title="Upper Band")
plot(lower, color=color.green, title="Lower Band")

// Strategy Orders
if longCondition
    strategy.entry("Long", strategy.long)

if shortCondition
    strategy.entry("Short", strategy.short)

// Exit conditions (optional)
takeProfitPerc = input.float(5, title="Take Profit %") / 100
stopLossPerc = input.float(2, title="Stop Loss %") / 100

// Calculate TP/SL levels
longTP = strategy.position_avg_price * (1 + takeProfitPerc)
longSL = strategy.position_avg_price * (1 - stopLossPerc)
shortTP = strategy.position_avg_price * (1 - takeProfitPerc)
shortSL = strategy.position_avg_price * (1 + stopLossPerc)

// Exit strategy
strategy.exit("Long TP/SL", from_entry="Long", limit=longTP, stop=longSL)
strategy.exit("Short TP/SL", from_entry="Short", limit=shortTP, stop=shortSL)