
Overview
This strategy is an innovative quantitative trading approach focused on capturing precise trading signals and managing risks by combining Supertrend, Exponential Moving Average (EMA), and Relative Strength Index (RSI). The strategy aims to provide traders with a dynamic, multi-dimensional market trend tracking mechanism applicable across 1-minute, 5-minute, and 15-minute charts.
Strategy Principles
The core principle is based on the synergistic action of three key technical indicators:
- Supertrend: Provides market trend judgment by calculating Average True Range (ATR) and price movement direction.
- Exponential Moving Average (EMA): Serves as a dynamic support/resistance line, helping determine price position relative to the average line.
- Relative Strength Index (RSI): Evaluates market momentum and identifies overbought and oversold conditions.
The strategy generates trading signals through comprehensive analysis of these three indicators:
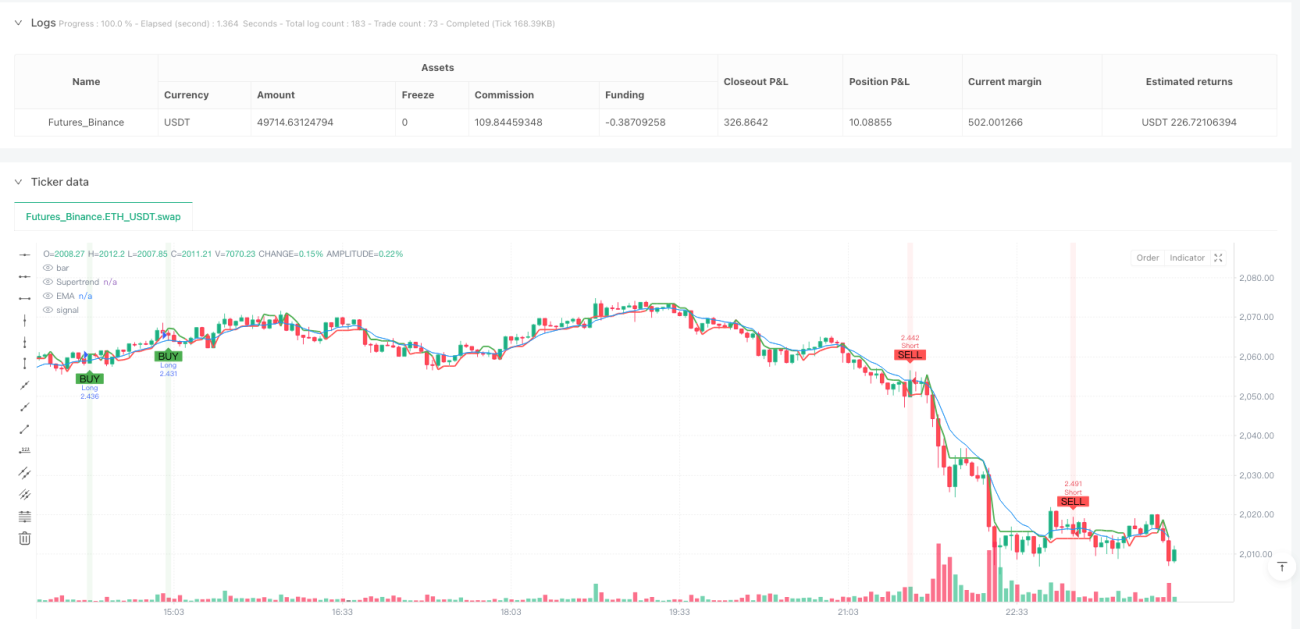
- Long Signal: Supertrend is bullish + Price above EMA + RSI above 40
- Short Signal: Supertrend is bearish + Price below EMA + RSI below 60
Strategy Advantages
- Multi-Dimensional Signal Verification: Significantly improves signal reliability through cross-validation of three indicators.
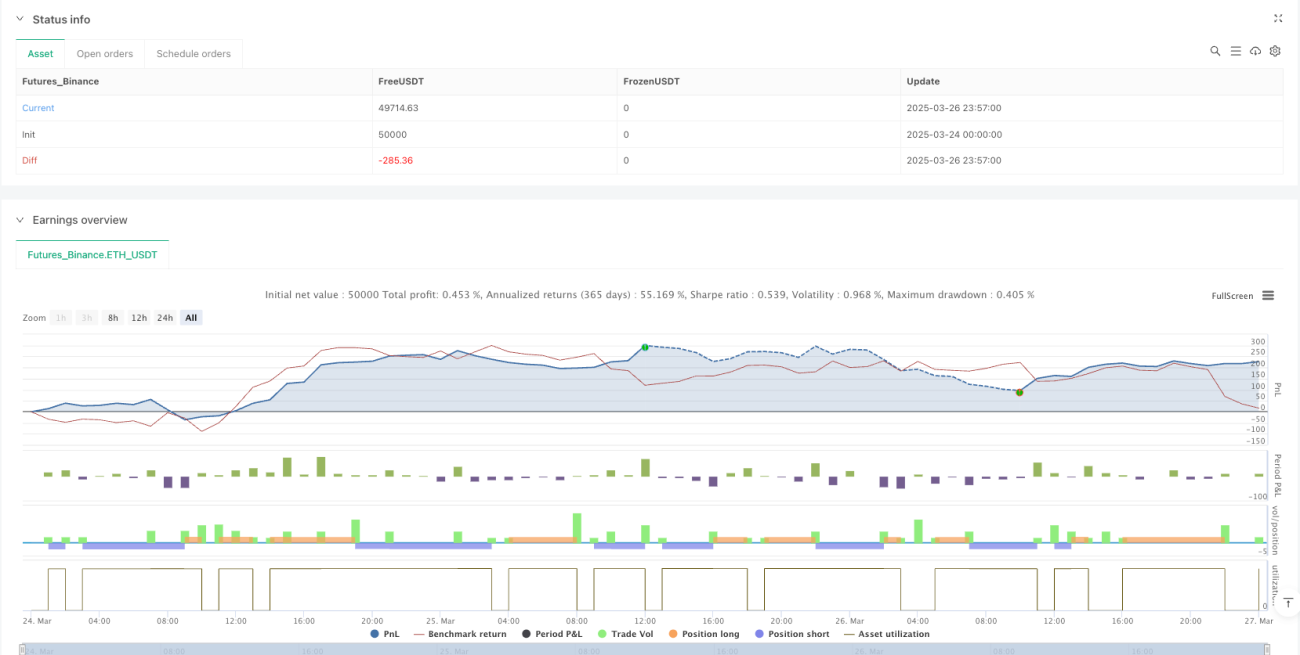
- Dynamic Risk Management: Adaptive stop-loss and take-profit mechanism based on ATR.
- High Flexibility: Applicable across multiple time periods (1-minute, 5-minute, 15-minute).
- Single Position Control: Only one position allowed at a time, effectively controlling trading risk.
- Visualization Assistance: Provides clear buy/sell signal markers and key metrics table.
Strategy Risks
- Indicator Lag: Technical indicators have historical data dependency, potentially causing signal delays.
- Volatility Impact: Stop-losses may be frequently triggered in high-volatility markets.
- Parameter Sensitivity: ATR length, EMA period, and RSI thresholds significantly affect strategy performance.
- Transaction Costs: Frequent trading may incur high commission fees.
Strategy Optimization Directions
- Adaptive Parameters: Introduce machine learning algorithms to dynamically adjust parameters based on market conditions.
- Long-Short Portfolio: Combine trend-following and reversal strategies to balance strategy stability.
- Risk Allocation: Optimize position management with dynamic position sizing control.
- Multi-Timeframe Verification: Enhance signal verification mechanisms across multiple time periods.
- Transaction Cost Optimization: Reduce trading frequency and unnecessary trades.
Summary
This is a quantitative trading strategy integrating multi-dimensional technical analysis, providing traders with a dynamic and flexible trading decision framework through the synergistic action of Supertrend, EMA, and RSI. The strategy's core advantage lies in its multi-signal verification and adaptive risk management mechanism, while also requiring continuous optimization and adjustment by traders.
/*backtest
start: 2025-03-24 00:00:00
end: 2025-03-27 00:00:00
period: 3m
basePeriod: 3m
exchanges: [{"eid":"Futures_Binance","currency":"ETH_USDT"}]
*/

//@version=6
strategy("SOL Scalper - Supertrend + EMA + RSI (One Position at a Time)", overlay=true, initial_capital=1000, default_qty_type=strategy.percent_of_equity, default_qty_value=10, commission_type=strategy.commission.percent, commission_value=0.075)

// Inputs- 1