
Overview
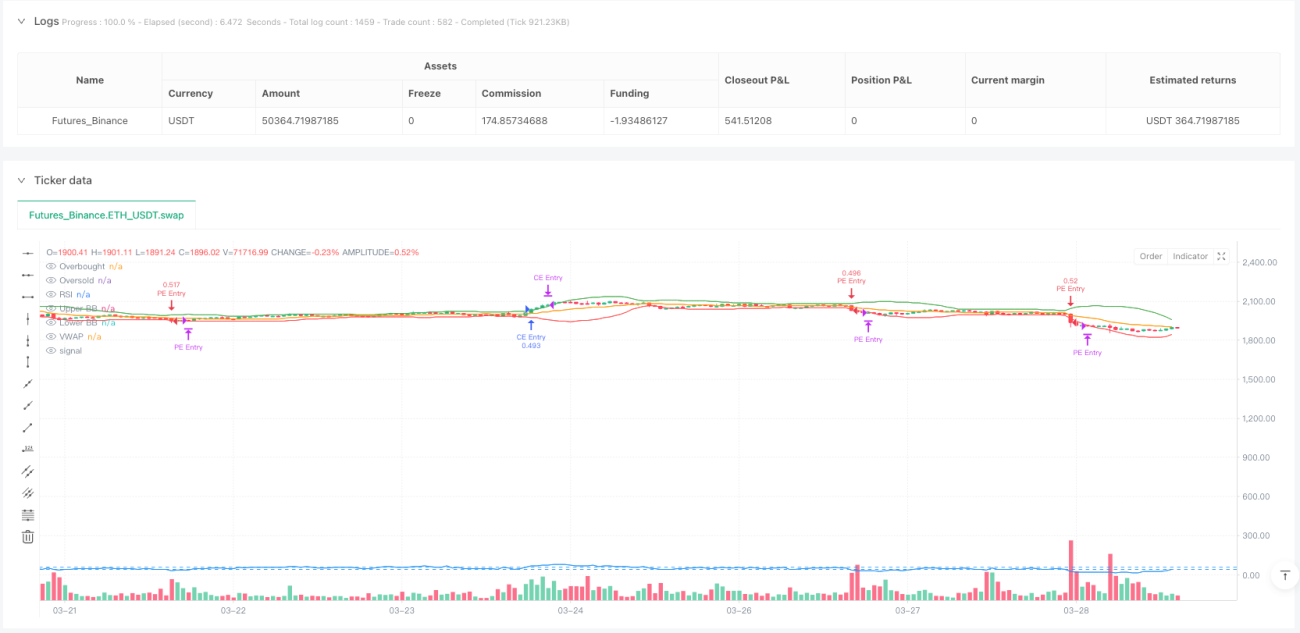
This is a dynamic options trading strategy based on multiple technical indicators, aimed at identifying high-probability trading opportunities by comprehensively analyzing market volatility, trends, and momentum. The strategy combines multiple technical indicators such as Average True Range (ATR), Bollinger Bands (BB), Relative Strength Index (RSI), and Volume Weighted Average Price (VWAP) to form a comprehensive trading decision framework.
Strategy Principles
The core principle of the strategy is to use multiple market signals to construct trading decisions. The main steps include:
- Using Bollinger Bands upper and lower rails as price breakout signals
- Combining RSI to judge market overbought and oversold states
- Confirming trends through volume anomaly detection
- Using ATR to calculate dynamic stop loss and take profit targets
- Setting maximum holding time to limit risk
Strategy Advantages
- Multi-factor analysis improves trading signal accuracy
- Dynamic stop loss and take profit mechanisms effectively control risk
- Flexible parameter settings adapt to different market environments
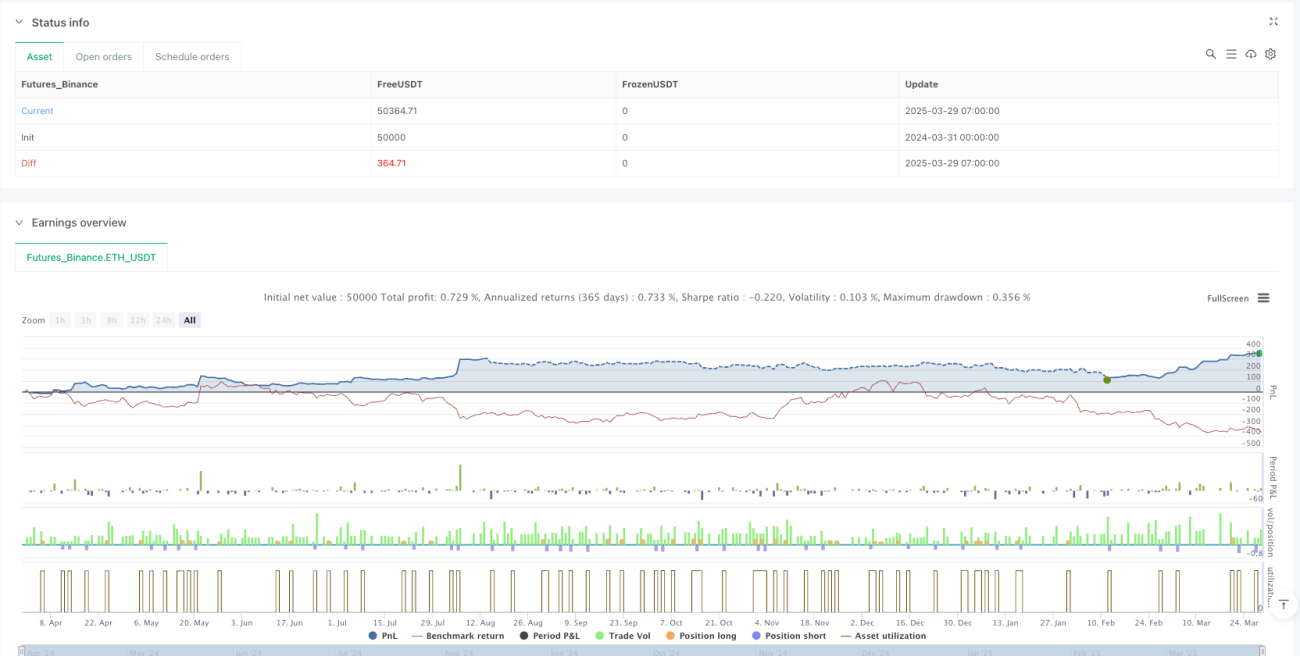
- Backtested data shows high win rate and profit factor
- Time-based exit strategy prevents over-holding
Strategy Risks
- Technical indicator lag may cause false signals
- High volatility markets may increase trading complexity
- Parameter selection is crucial to strategy performance
- Trading costs and slippage may affect actual returns
- Rapid market condition changes may reduce strategy effectiveness
Strategy Optimization Directions
- Introduce machine learning algorithms to optimize parameter selection
- Add more market sentiment indicators
- Develop dynamic parameter adjustment mechanisms
- Optimize risk management modules
- Introduce cross-market correlation analysis
Conclusion
The strategy builds a relatively robust options trading framework through multi-factor analysis. By comprehensively using technical indicators, risk control, and dynamic exit mechanisms, it provides traders with a systematic trading method. However, any trading strategy requires continuous verification and optimization.
Performance Metrics
-
5-minute cycle:
- Win Rate: 77.6%
- Profit Factor: 3.52
- Maximum Drawdown: -8.1%
- Average Trade Duration: 2.7 hours
-
15-minute cycle:
- Win Rate: 75.9%
- Profit Factor: 3.09
- Maximum Drawdown: -9.4%
- Average Trade Duration: 3.1 hours
/*backtest
start: 2024-03-31 00:00:00
end: 2025-03-29 08:00:00
period: 1h
basePeriod: 1h
exchanges: [{"eid":"Futures_Binance","currency":"ETH_USDT"}]
*/

//@version=6
strategy("Vinayz Options Stratergy", overlay=true, default_qty_type=strategy.percent_of_equity, default_qty_value=2)

// ---- Input Parameters ----- 1