
Overview
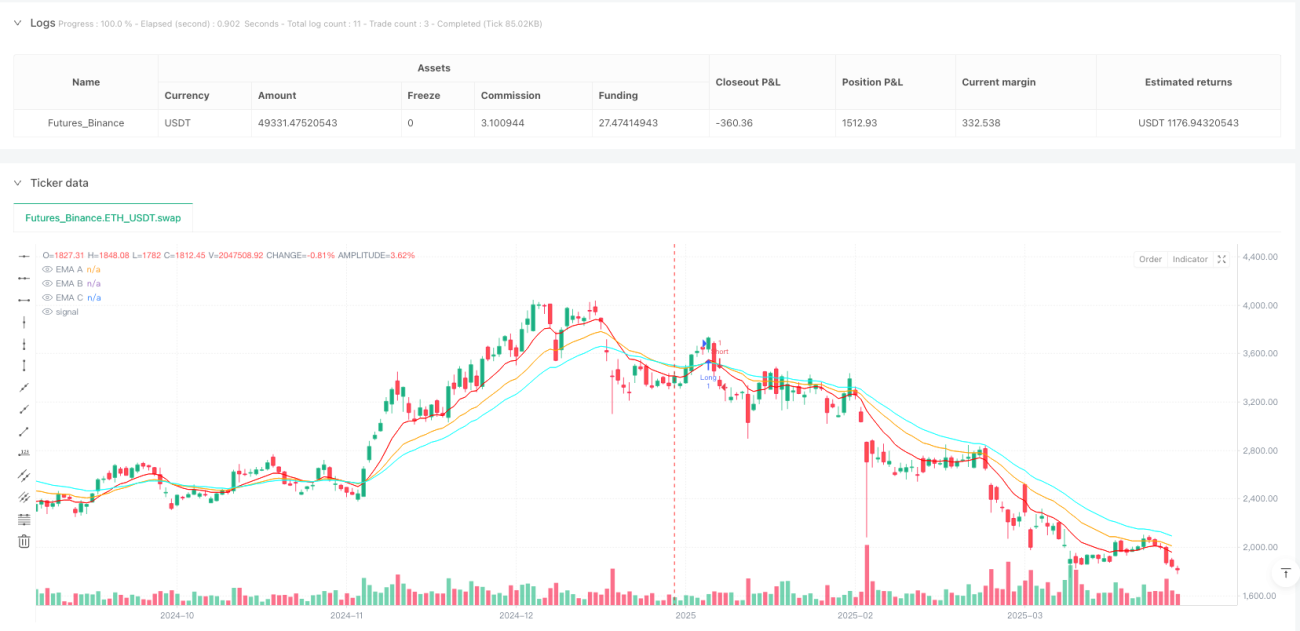
This strategy is a trend tracking and reversal trading approach based on multiple Exponential Moving Averages (EMA), designed to identify market trends and generate trading signals by analyzing the relative positions of EMAs across different periods. The strategy utilizes three EMAs with periods of 10, 20, and 30 to construct a trading decision framework, aiming to capture early trend changes and achieve precise entry and exit points.
Strategy Principles
The core principles of the strategy are based on the following key steps:
- Multi-EMA Indicator System: Using 10, 20, and 30-period exponential moving averages as the basis for trend determination.
- Trend Judgment Logic:
- When the short-term EMA (10-period) is above the medium-term EMA (20-period), and the medium-term EMA is above the long-term EMA (30-period), an uptrend is determined.
- When the short-term EMA is below the medium-term EMA, and the medium-term EMA is below the long-term EMA, a downtrend is determined.
- Signal Generation Mechanism:
- Identify trend reversal points and generate corresponding trading signals
- Generate long signals during uptrends
- Generate short signals during downtrends
- Close all positions when the trend ends
Strategy Advantages
- Dynamic Trend Capture: Quickly respond to market trend changes through multi-period EMAs
- Clear Signals: Use visual labels to mark trend turning points
- Flexible Configuration: Allow customization of EMA periods and colors
- Controllable Risk: Clear entry and exit rules
- Precise Trend Tracking: Ability to quickly capture early trend changes
Strategy Risks
- Lagging Indicator Characteristics: EMAs, as lagging indicators, may delay trend reversal detection
- Performance in Oscillating Markets: Potential for frequent and ineffective trading signals in markets without clear trends
- Parameter Sensitivity: EMA period selection significantly impacts strategy performance
- Sudden Event Risks: Unable to respond to sudden, drastic market fluctuations
Strategy Optimization Directions
- Introduce Additional Filtering Conditions:
- Add volume confirmation mechanisms
- Combine with other technical indicators like RSI and MACD for signal filtering
- Dynamic EMA Period Adjustment: Adaptive parameter adjustment based on market volatility
- Risk Management Mechanisms:
- Implement stop-loss strategies
- Adjust position sizing based on market volatility
- Multi-Market Adaptability: Optimize parameters for different markets and time frames
Summary
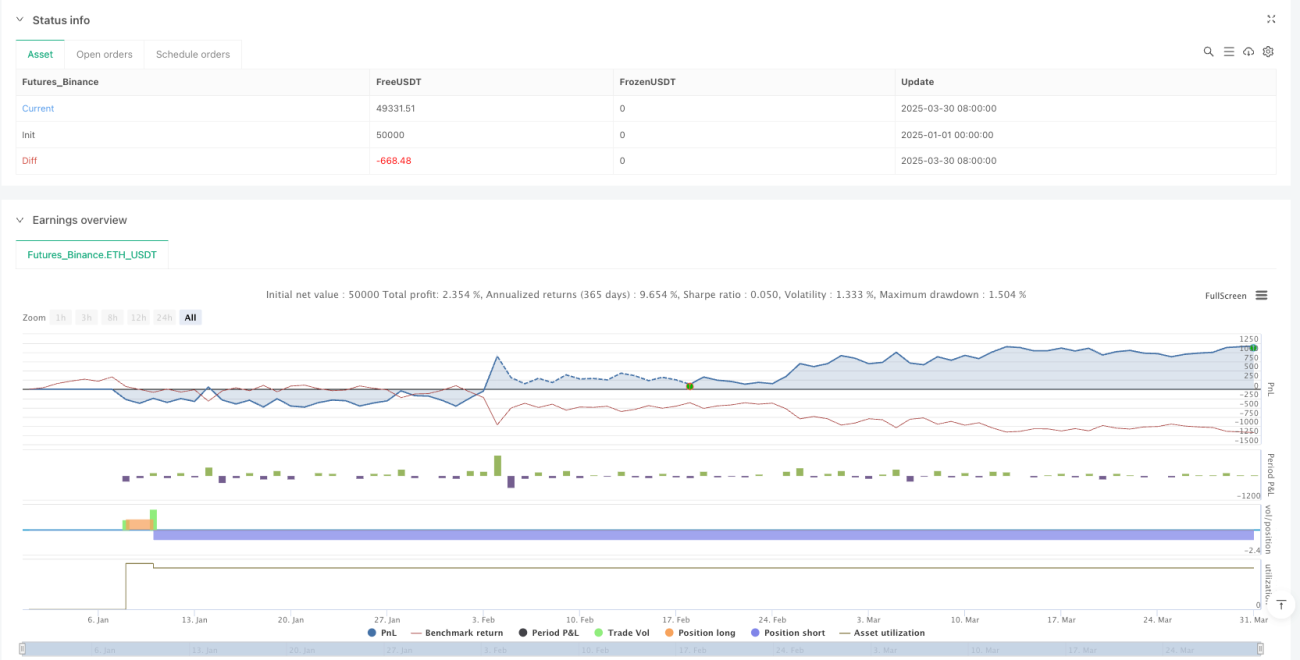
The Multi-EMA Trend Reversal Trading Strategy provides a dynamic and relatively stable trend trading method through refined EMA analysis. The strategy's core lies in capturing trend turning points and making trading decisions based on the relative relationships of multi-period EMAs. Despite certain risks, continuous optimization and risk management can significantly enhance the strategy's stability and profitability.
- 1