Multi-Dynamic Indicator Combination Strategy

ATR BB ST MA VWMA
Created on: 2025-04-01 10:12:19 Modified on: 2025-04-01 10:12:19
Copy: 4 Number of hits: 294
avatar of ianzeng123 ianzeng123
2
Follow
319
Followers

 Multi-Dynamic Indicator Combination Strategy  Multi-Dynamic Indicator Combination Strategy

Overview

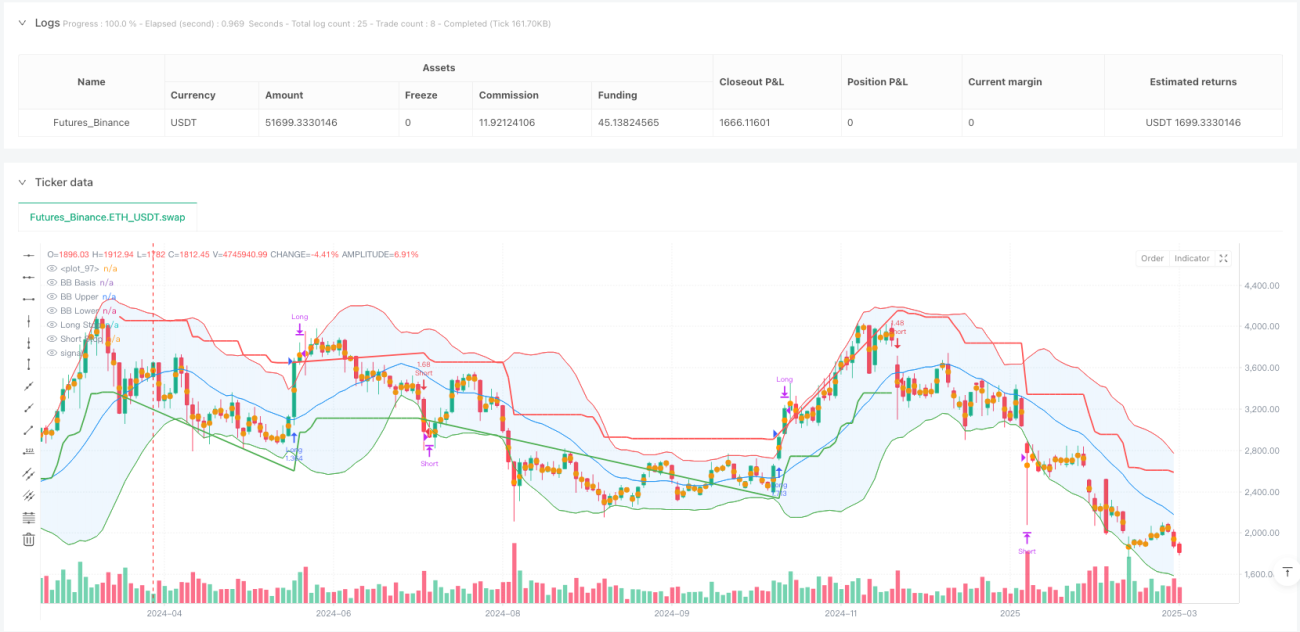
This article introduces a composite trading strategy combining Bollinger Bands and SuperTrend indicators. The strategy aims to provide more precise market entry and exit signals by integrating multiple technical analysis tools while reducing trading risks.

Strategy Principle

The strategy’s core consists of two main parts: Bollinger Bands and SuperTrend indicators.

  1. Bollinger Bands Calculation:
  • Uses configurable moving average (MA) to calculate the baseline
  • Generates upper and lower bands based on standard deviation multiplier
  • Supports multiple moving average types: Simple Moving Average (SMA), Exponential Moving Average (EMA), Smoothed Moving Average (SMMA), Weighted Moving Average (WMA), and Volume Weighted Moving Average (VWMA)
  1. SuperTrend Component:
  • Calculates stop-loss levels using Average True Range (ATR)
  • Dynamically determines market trend direction
  • Generates buy and sell signals based on trend changes

Strategy Advantages

  1. Multi-Indicator Combination: Improves signal accuracy by combining Bollinger Bands and SuperTrend
  2. Flexible Configuration: Customizable moving average types, parameters, and calculation methods
  3. Dynamic Stop-Loss: ATR-based stop-loss mechanism effectively controls risk
  4. Visual Enhancement: Provides trend state filling and signal labels
  5. Risk Management: Percentage position management and pyramid trading restrictions

Strategy Risks

  1. Parameter Sensitivity: Parameters may require frequent adjustments in different market environments
  2. Backtesting Limitations: Historical performance does not guarantee future market results
  3. Position Switching Risk: Frequent position changes may increase trading costs
  4. Indicator Lag: Technical indicators have inherent signal delays

Strategy Optimization Directions

  1. Introduce machine learning algorithms for dynamic parameter optimization
  2. Add additional filtering conditions, such as volume confirmation
  3. Develop multi-timeframe verification mechanisms
  4. Optimize risk management module with more precise position control strategies
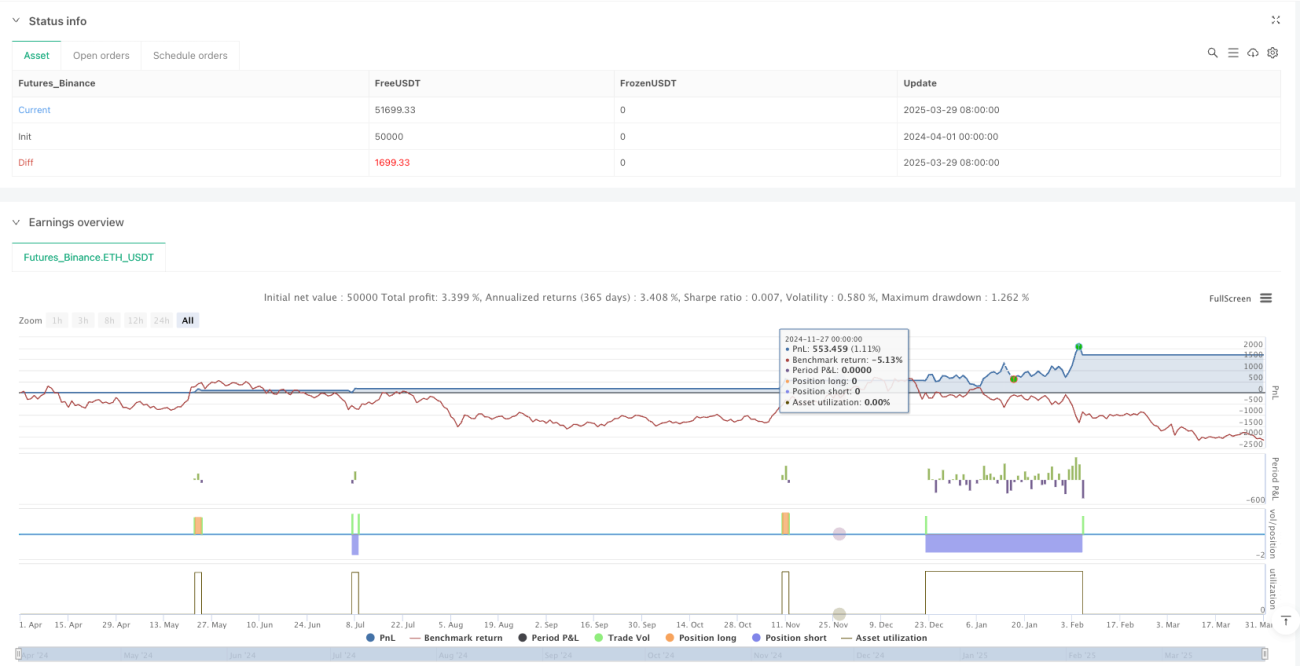
Summary

This is a trading strategy combining multiple dynamic indicators, providing a relatively comprehensive trading signal system through the combination of Bollinger Bands and SuperTrend. The strategy’s core lies in balancing signal accuracy and risk management, but still requires continuous optimization and adjustment according to different market environments.

Strategy source code
/*backtest
start: 2024-04-01 00:00:00
end: 2025-03-31 00:00:00
period: 2d
basePeriod: 2d
exchanges: [{"eid":"Futures_Binance","currency":"ETH_USDT"}]
*/

//@version=6
strategy("Combined BB & New SuperTrend Strategy", overlay=true, initial_capital=100000, default_qty_type=strategy.percent_of_equity, default_qty_value=10, pyramiding=0)

//============================
// Bollinger Bands Parameters
//============================
lengthBB   = input.int(20, minval=1, title="BB Length")
maType     = input.string("SMA", "BB Basis MA Type", options=["SMA", "EMA", "SMMA (RMA)", "WMA", "VWMA"])
srcBB      = input(close, title="BB Source")
multBB     = input.float(2.0, minval=0.001, maxval=50, title="BB StdDev Multiplier")
offsetBB   = input.int(0, title="BB Offset", minval=-500, maxval=500)

// Moving average function based on chosen type
ma(source, length, _type) =>
    switch _type
        "SMA"         => ta.sma(source, length)
        "EMA"         => ta.ema(source, length)
        "SMMA (RMA)"  => ta.rma(source, length)
        "WMA"         => ta.wma(source, length)
        "VWMA"        => ta.vwma(source, length)

// Bollinger Bands calculations
basis   = ma(srcBB, lengthBB, maType)
dev     = multBB * ta.stdev(srcBB, lengthBB)
upperBB = basis + dev
lowerBB = basis - dev

// Plot Bollinger Bands
plot(basis, title="BB Basis", color=color.blue, offset=offsetBB)
p1 = plot(upperBB, title="BB Upper", color=color.red, offset=offsetBB)
p2 = plot(lowerBB, title="BB Lower", color=color.green, offset=offsetBB)
fill(p1, p2, title="BB Fill", color=color.new(color.blue, 90))

//============================
// New SuperTrend Parameters & Calculations
// (Based on the new script you provided)
//============================
st_length         = input.int(title="ATR Period", defval=22)
st_mult           = input.float(title="ATR Multiplier", step=0.1, defval=3)
st_src            = input.source(title="SuperTrend Source", defval=hl2)
st_wicks          = input.bool(title="Take Wicks into Account?", defval=true)
st_showLabels     = input.bool(title="Show Buy/Sell Labels?", defval=true)
st_highlightState = input.bool(title="Highlight State?", defval=true)

// Calculate ATR component for SuperTrend
st_atr = st_mult * ta.atr(st_length)

// Price selection based on wicks option
st_highPrice = st_wicks ? high : close
st_lowPrice  = st_wicks ? low  : close
st_doji4price = (open == close and open == low and open == high)

// Calculate SuperTrend stop levels
st_longStop = st_src - st_atr
st_longStopPrev = nz(st_longStop[1], st_longStop)
if st_longStop > 0
    if st_doji4price
        st_longStop := st_longStopPrev
    else
        st_longStop := (st_lowPrice[1] > st_longStopPrev ? math.max(st_longStop, st_longStopPrev) : st_longStop)
else
    st_longStop := st_longStopPrev

st_shortStop = st_src + st_atr
st_shortStopPrev = nz(st_shortStop[1], st_shortStop)
if st_shortStop > 0
    if st_doji4price
        st_shortStop := st_shortStopPrev
    else
        st_shortStop := (st_highPrice[1] < st_shortStopPrev ? math.min(st_shortStop, st_shortStopPrev) : st_shortStop)
else
    st_shortStop := st_shortStopPrev

// Determine trend direction: 1 for bullish, -1 for bearish
var int st_dir = 1
st_dir := st_dir == -1 and st_highPrice > st_shortStopPrev ? 1 : st_dir == 1 and st_lowPrice < st_longStopPrev ? -1 : st_dir

// Define colors for SuperTrend
st_longColor  = color.green
st_shortColor = color.red

// Plot SuperTrend stops
st_longStopPlot  = plot(st_dir == 1 ? st_longStop : na, title="Long Stop", style=plot.style_line, linewidth=2, color=st_longColor)
st_shortStopPlot = plot(st_dir == -1 ? st_shortStop : na, title="Short Stop", style=plot.style_line, linewidth=2, color=st_shortColor)

// Generate SuperTrend signals based on direction change
st_buySignal  = st_dir == 1 and st_dir[1] == -1
st_sellSignal = st_dir == -1 and st_dir[1] == 1

// Optionally plot labels for buy/sell signals
if st_buySignal and st_showLabels
    label.new(bar_index, st_longStop, "Buy", style=label.style_label_up, color=st_longColor, textcolor=color.white, size=size.tiny)
if st_sellSignal and st_showLabels
    label.new(bar_index, st_shortStop, "Sell", style=label.style_label_down, color=st_shortColor, textcolor=color.white, size=size.tiny)

// Fill the state area (optional visual enhancement)
st_midPricePlot = plot(ohlc4, title="", style=plot.style_circles, linewidth=1, display=display.none)
st_longFillColor  = st_highlightState ? (st_dir == 1 ? st_longColor : na) : na
st_shortFillColor = st_highlightState ? (st_dir == -1 ? st_shortColor : na) : na
fill(st_midPricePlot, st_longStopPlot, title="Long State Filling", color=st_longFillColor)
fill(st_midPricePlot, st_shortStopPlot, title="Short State Filling", color=st_shortFillColor)

//============================
// Trading Logic
//============================

// When a bullish reversal occurs, close any short position before entering long.
if st_buySignal
    strategy.close("Short")
    strategy.entry("Long", strategy.long)

// When a bearish reversal occurs, close any long position before entering short.
if st_sellSignal
    strategy.close("Long")
    strategy.entry("Short", strategy.short)

// Exit conditions using Bollinger Bands:
// - For a long position: exit if price reaches (or exceeds) the upper Bollinger Band.
// - For a short position: exit if price reaches (or falls below) the lower Bollinger Band.
if strategy.position_size > 0 and close >= upperBB
    strategy.close("Long", comment="Exit Long via BB Upper")
if strategy.position_size < 0 and close <= lowerBB
    strategy.close("Short", comment="Exit Short via BB Lower")