Adaptive Volatility Breakout Retest Trading Strategy

Overview
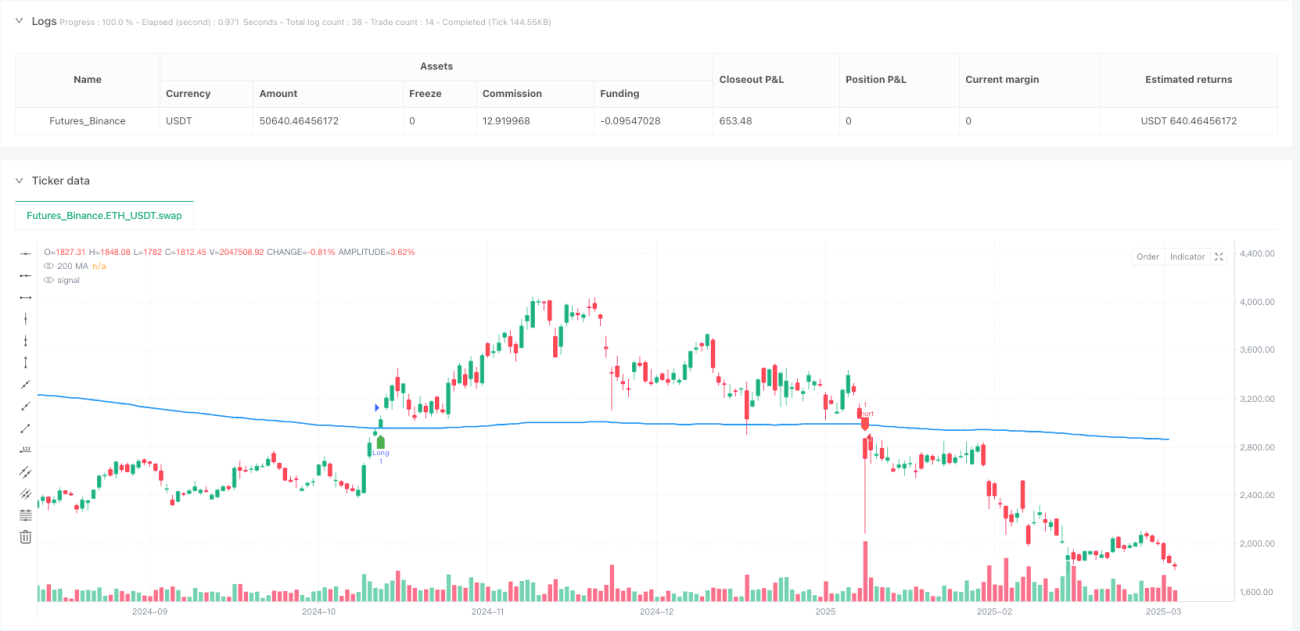
The Adaptive Volatility Breakout Retest Trading Strategy is a high-frequency trading (HFT) system that capitalizes on the relationship between price and the 200-day moving average (MA200). The strategy first identifies breakouts above or below the MA200, then waits for price to retest the MA200 for confirmation, and finally enters trades when both conditions are met. The strategy employs adaptive stop-loss and take-profit levels based on Average True Range (ATR), allowing it to automatically adjust risk and profit targets according to market volatility, enabling rapid market entries and exits characteristic of high-frequency trading.
Strategy Principles
The core principles of this strategy are based on trend following and volatility measurement in technical analysis, consisting of several key components:
-
Trend Identification: Uses a 200-day Simple Moving Average (SMA) as a reference indicator for long-term trends. This is a widely recognized trend demarcation line, with prices above it generally considered in an uptrend and prices below it in a downtrend.
-
Breakout Signals: When price crosses above the MA200 from below, a bullish breakout signal (breakoutUp) is generated; when price crosses below the MA200 from above, a bearish breakout signal (breakoutDown) is generated.
-
Retest Confirmation: After a breakout, the strategy doesn't enter immediately but waits for price to retest the MA200. Specifically, after a bullish breakout, if the lowest price within 5 periods is less than or equal to the MA200, it confirms a valid retest (retestUp); after a bearish breakout, if the highest price within 5 periods is greater than or equal to the MA200, it confirms a valid retest (retestDown).
-
Entry Conditions: Entry signals are triggered only when both breakout and retest conditions are satisfied. A bullish entry (longCondition) requires both breakoutUp and retestUp; a bearish entry (shortCondition) requires both breakoutDown and retestDown.
-
Adaptive Risk Management: The strategy uses a 14-period ATR to measure market volatility and sets stop-loss and take-profit levels through a user-adjustable risk factor (riskFactor). Both stop-loss and take-profit levels are calculated based on the current price plus or minus (ATR * riskFactor), allowing the system to automatically adjust risk and profit targets according to market volatility conditions.
-
Rapid Trade Execution: Once trading conditions are triggered, the system immediately executes the trade and sets corresponding stop-loss and take-profit levels to capture profits in small price movements.
Strategy Advantages
-
Strong Adaptability: By dynamically adjusting stop-loss and take-profit levels through ATR, the strategy can adapt to different market conditions and volatility environments without manual parameter adjustments.
-
Precise Risk Control: Each trade has a preset stop-loss level based on current market volatility, effectively controlling risk exposure for each trade.
-
Quick Profit Capture: Setting take-profit levels that match stop-loss levels ensures profits can be quickly locked in when price moves in a favorable direction, suitable for high-frequency trading environments.
-
Combining Trend and Retest: Not only identifies trend breakouts but also requires price to retest key support/resistance levels (MA200) for confirmation, reducing false signals from false breakouts.
-
Clear Visual Feedback: The strategy marks all trading signals and the MA200 line on the chart, allowing traders to visually assess strategy performance and market conditions.
-
Adjustable Parameters: Through the risk multiplier parameter, traders can adjust the aggressiveness of the strategy according to their risk preferences and trading objectives.
Strategy Risks
-
High-Frequency Trading Costs: As the strategy may generate numerous trading signals, trading costs (such as fees and slippage) could significantly impact actual returns. The solution is to incorporate real trading costs in backtesting and live trading, and potentially add additional filtering conditions to reduce trading frequency.
-
Volatility Misjudgment: In extremely low or high volatility environments, ATR may not accurately reflect true risk, leading to stops that are too tight or too loose. Consider using multi-period ATR or dynamically adjusting the ATR period to mitigate this issue.
-
False Breakout Risk: Despite the retest confirmation mechanism, the market may still exhibit large reverse movements after false breakouts, triggering stop-losses. Additional confirmation indicators, such as volume or the use of other technical indicators, can be incorporated.
-
Insensitivity to Trend Reversals: Using the 200-day SMA as a long-term trend indicator may be slow to react at trend inflection points, leading to missed trading opportunities at the beginning of new trends. Consider combining short and medium-term moving averages to form a moving average system.
-
Parameter Dependency: Strategy performance has a certain dependency on parameter settings such as the risk factor and ATR period, with different markets potentially requiring different parameters. Robust parameter optimization and out-of-sample testing are recommended to determine the optimal parameter combination.
Strategy Optimization Directions
-
Add Volume Confirmation: Incorporate volume conditions in trading signals, such as requiring high volume during breakouts and retests, to increase signal reliability. This can filter out weak breakouts without sufficient market participation.
-
Dynamic Risk Factor: The current strategy uses a fixed risk multiplier; consider dynamically adjusting the risk factor based on market volatility state, for example, reducing the risk factor in high volatility environments and appropriately increasing it in low volatility environments.
-
Time Filter: Add a trading time filter to avoid high volatility periods around market open and close, or only trade during specific high liquidity periods, which can reduce significant slippage due to insufficient liquidity.
-
Multi-timeframe Confirmation: Introduce multi-timeframe analysis, requiring the trend direction in higher timeframes to be consistent with the trading direction, which can improve system stability and win rate.
-
Take-Profit Strategy Optimization: Consider implementing a stepped take-profit strategy, such as moving the take-profit point for a portion of the position after reaching a certain profit, or using trailing stops to lock in more profit.
-
Indicator Combination: Combine with other technical indicators such as RSI, MACD, or Bollinger Bands to build a multiple confirmation system, executing trades only when multiple indicators give signals simultaneously.
Summary
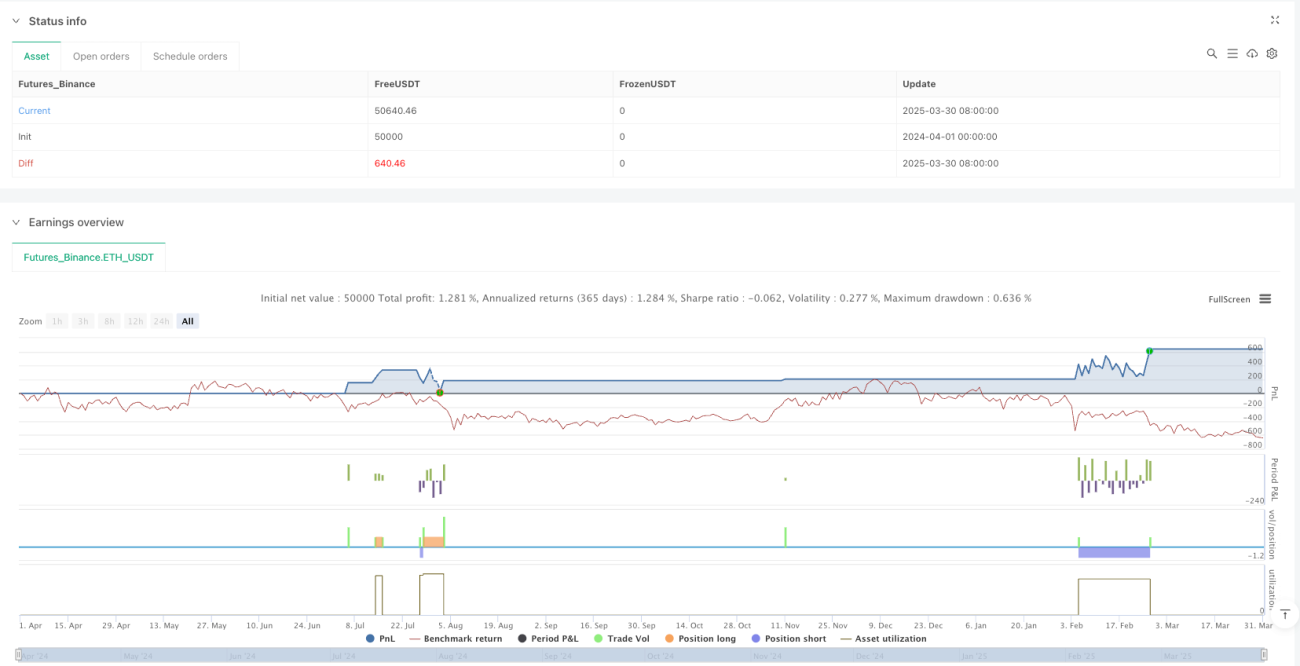
The Adaptive Volatility Breakout Retest Trading Strategy is a high-frequency trading system that combines trend following, retest confirmation, and adaptive risk management. By identifying the interaction between price and the 200-day moving average, and combining ATR to dynamically adjust stop-loss and take-profit levels, this strategy can maintain consistent risk control under different market conditions while capturing trading opportunities brought by short-term price movements. While there are inherent risks such as trading costs and false breakout issues, through improvement measures proposed in the optimization directions, such as adding volume confirmation, dynamic risk factor adjustment, and multi-timeframe analysis, the stability and profitability of the strategy can be further enhanced. This strategy is particularly suitable for investors who have a certain understanding of technical analysis and wish to engage in high-frequency trading through a systematic approach.
- 1