
Overview
The Dual EMA Trend Following Quantitative Strategy is a trading system based on Exponential Moving Averages (EMA) that identifies sustainable market trends by comparing the difference between fast and slow EMAs against the Average True Range (ATR). This strategy is specifically designed for long-term traders seeking stable and persistent trend signals, utilizing a dynamically adjusted ATR multiplier as a filter to effectively reduce false signals and improve trading quality.
Strategy Principle
The core principle of this strategy is based on the interaction between two Exponential Moving Averages with different periods. The specific implementation is as follows:
- Uses two EMA lines: a fast EMA (default 30 periods) and a slow EMA (default 60 periods)
- Calculates the difference between the two EMAs (emaDiff = emaFast - emaSlow)
- Compares this difference with the product of ATR (emaMarginATRMult * ta.atr(emaMarginATRLen))
- Confirms an uptrend (emaBull) when the difference exceeds the ATR product, and confirms a downtrend (emaBear) when the difference is less than the negative ATR product
- Generates trading signals:
- Buy signal: when the EMA difference crosses above the ATR product (ta.crossover)
- Sell signal: when the EMA difference crosses below the negative ATR product (ta.crossunder)
The strategy uses ATR as a dynamic threshold that automatically adjusts signal sensitivity based on market volatility, allowing the strategy to maintain stable performance across different volatility environments.
Strategy Advantages
- High signal reliability: By introducing ATR as a dynamic filter, the strategy effectively filters market noise, capturing only truly meaningful trend changes
- Adapts to market volatility: The ATR multiplier design allows signal thresholds to automatically adjust with market volatility, increasing thresholds during high volatility periods and decreasing them during low volatility periods
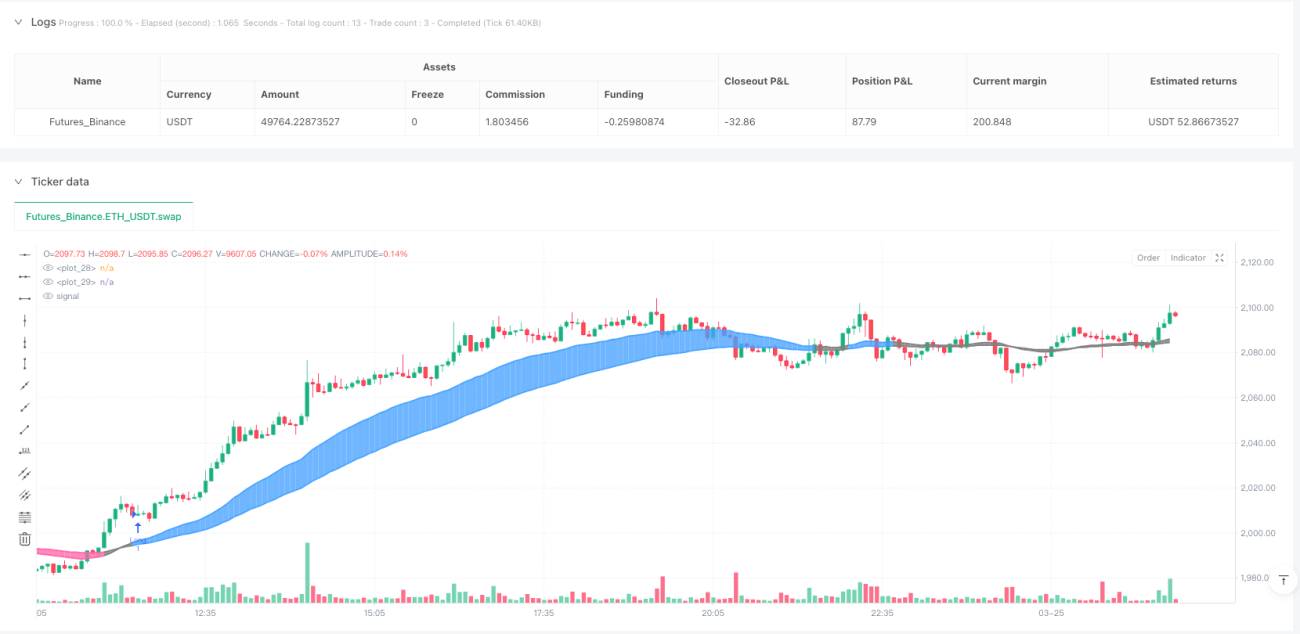
- Clear visual feedback: The strategy provides intuitive visualization of market conditions through dynamic color changes (blue for uptrends, pink for downtrends, gray for neutral), making it easy for traders to understand the current market environment
- Customizable parameters: The strategy offers several adjustable parameters, including fast EMA length, slow EMA length, ATR period, and ATR multiplier, allowing traders to optimize according to different market characteristics and personal risk preferences
- Long-term stability: This strategy focuses on capturing strong, sustainable trends, avoiding frequent trading, reducing transaction costs, and is more suitable for long-term investors
Strategy Risks
- Delayed trend confirmation: Due to the use of moving averages, the strategy lags during the initial stages of trends, potentially missing part of the initial price movement
- Poor performance in ranging markets: In sideways markets with no clear trend, the strategy may generate frequent false signals, leading to consecutive losses
- Parameter sensitivity: Strategy performance is relatively sensitive to parameter selection, especially the ATR multiplier, where inappropriate choices can lead to too many or too few signals
- Lack of stop-loss mechanism: The current version does not include a clear stop-loss strategy, potentially facing significant losses when trends suddenly reverse
- One-directional trading limitation: The commented code indicates that the current strategy only executes long trades and closes positions, not fully utilizing short-selling opportunities
Risk mitigation methods:
- Add additional trend confirmation indicators, such as Relative Strength Index (RSI) or MACD
- Implement appropriate stop-loss strategies, such as trailing stops or fixed percentage stops
- Find more robust parameter settings by backtesting parameter combinations under different market conditions
- Pause trading or adjust parameters in sideways markets to reduce false signals
Strategy Optimization Directions
- Introduce multi-timeframe analysis: Integrating trend determinations from longer timeframes can improve signal quality, executing trades only when the major trend direction aligns
- Optimize entry and exit mechanisms: Consider seeking better entry points after signals trigger, such as entering on pullbacks to support levels, to improve entry prices
- Add position management: Dynamically adjust position sizes based on trend strength and market volatility, increasing positions in strong trends and reducing them in weak trends
- Integrate short-selling strategy: Fully enable the short-selling functionality that exists but is commented out in the code, allowing the strategy to profit from downtrends
- Add stop-loss and profit-taking strategies: Implement dynamic stop-losses such as ATR multiples or key support/resistance levels to improve risk management capabilities
- Introduce volatility filters: Pause trading in extremely high volatility environments to avoid potential significant losses under abnormal market conditions
- Add seasonality and time filters: Analyze strategy performance during different time periods, potentially disabling the strategy during specific periods
The core objective of these optimization directions is to enhance the robustness of the strategy, maintaining good performance across a wider range of market conditions while strengthening risk management functions to protect capital.
Summary
The Dual EMA Trend Following Quantitative Strategy is a well-designed trading system that provides reliable trend signals by combining Exponential Moving Averages with the Average True Range indicator. Its core strength lies in using dynamic thresholds to filter market noise, making trading signals more reliable.
This strategy is particularly suitable for traders seeking long-term, stable trends, reducing trading costs and psychological pressure by minimizing frequent trading and false signals. Although inherent risks exist, such as delayed trend confirmation and poor performance in ranging markets, these can be mitigated through parameter optimization and additional risk management measures.
Further optimization opportunities include multi-timeframe analysis, improved entry and exit mechanisms, dynamic position management, and more comprehensive risk controls. With these improvements, the strategy has the potential to become a comprehensive trading system that adapts to a wider range of market environments and provides stable long-term returns.
- 1