
Overview
This trading strategy is a comprehensive quantitative trading system that combines multiple technical indicators with AI-assisted signal filtering. The strategy utilizes Triple Exponential Moving Average (TEMA), Kaufman Adaptive Moving Average (KAMA), MACD, Relative Strength Index (RSI), Average True Range (ATR), and volume analysis to identify potential entry and exit points. Through an AI signal filtering mechanism, the strategy can screen for high-confidence trading signals and uses dynamic risk management techniques to set stop-loss and take-profit levels.
Strategy Principle
The core principle of this strategy is built on multi-indicator crossovers and confirmatory conditions:
-
Indicator Calculation:
- Triple Exponential Moving Average (TEMA): Applies exponential smoothing three times to reduce lag
- Kaufman Adaptive Approximation (Linear Regression): Uses linear regression instead of traditional KAMA to provide price trend prediction
- MACD: Calculates fast line, slow line, and signal line to identify momentum changes
- RSI: Measures the speed and magnitude of price movements to identify overbought and oversold areas
- ATR: Measures market volatility, used for setting dynamic stop points
-
AI Signal Filtering:
The strategy creates a weighted confidence score by incorporating:- Normalized MACD histogram relative to historical highs
- RSI deviation from the centerline (50)
- Volume ratio relative to average volume
These three metrics are averaged to form the AI signal, and trades are only executed when this signal exceeds a set threshold.
-
Entry Conditions:
Long entry requirements:- KAMA crosses above TEMA (trend turns upward)
- MACD line is above the signal line (upward momentum)
- RSI is above oversold level (price has rebound momentum)
- Volume is higher than a specific multiple of average volume (strong market participation)
- AI confidence is above threshold (comprehensive confirmation)
Opposite conditions apply for short entries.
-
Risk Management:
- Dynamic stop-loss points calculated based on ATR, adapting to market volatility
- Take-profit levels set based on risk-reward ratio, ensuring consistent risk-reward proportion for each trade
Strategy Advantages
-
Multi-dimensional Signal Confirmation:
By requiring multiple independent indicators to confirm simultaneously, the strategy reduces the possibility of false signals. The TEMA and KAMA crossover provides trend direction, while MACD and RSI confirm momentum and overbought/oversold conditions respectively. -
Dynamic Risk Management:
The ATR-based stop-loss method adapts to current market volatility, ensuring stops aren't triggered by market noise but also aren't too loose in highly volatile environments. -
AI-Enhanced Filtering:
While the AI implementation in the code is simulated, it integrates three key market aspects (price momentum, overbought/oversold conditions, and volume anomalies), adding an extra layer of confirmation to traditional indicators. -
Volume Confirmation:
By requiring trades to occur during abnormally high volume, the strategy ensures entry into movements with sufficient market participation, which typically indicates more reliable price movements. -
Flexible Parameterization:
The strategy offers multiple adjustable parameters, allowing traders to optimize according to different market conditions or personal risk preferences.
Strategy Risks
-
Parameter Optimization Overfitting:
The strategy includes multiple parameters (such as TEMA length, KAMA length, MACD settings, etc.). Excessive optimization of these parameters may lead to overfitting, performing well on historical data but poorly in future live markets. This can be mitigated through walk-forward optimization and robustness testing across multiple market conditions. -
Limitations of Technical Indicators:
All indicators used are inherently lagging and may provide inaccurate signals in rapidly changing markets or extreme conditions. The addition of the AI confidence score partially mitigates this issue but cannot eliminate it entirely. -
Increased Failure Points in Complex Systems:
As the strategy relies on multiple indicators and conditions being met simultaneously, it may lead to reduced trading frequency, missing some potentially favorable opportunities. In low-volatility or sideways markets, this conservative approach may result in extended periods without trades. -
Limitations of AI Simulation:
The "AI" in the code is actually a simplified mathematical model, not a true machine learning algorithm. It lacks adaptive learning and true pattern recognition capabilities, potentially not being as effective at identifying complex market patterns as actual AI. -
Impact of Slippage and Commissions:
Although the strategy considers slippage and commissions, in actual trading, these costs may be higher than expected, especially in low-liquidity or high-volatility environments, affecting the overall profitability of the strategy.
Strategy Optimization Directions
-
True AI Integration:
Replace the simple AI signal with a genuine machine learning model, such as random forests or neural networks. This can be implemented through externally trained models with predictions fed into the strategy, improving the ability to identify genuine patterns. -
Market State Adaptation:
Add market state recognition logic (such as trending, ranging, or high-volatility states) to automatically adjust parameters based on different market environments. For example, more sensitive indicator settings might be needed in ranging markets, while more conservative settings are appropriate in trending markets. -
Time Filters:
Implement time filtering mechanisms to avoid trading during major economic data releases or low-liquidity market sessions, reducing risks from abnormal volatility. -
Improved Stop-Loss Strategy:
Consider implementing trailing stops or support/resistance-based stops rather than relying solely on ATR. This would better protect profits and adapt to changing market structures. -
Optimized Position Management:
The current strategy uses a fixed percentage of funds for each trade. Implementing dynamic position sizing based on market volatility, signal strength, and historical win rates would achieve optimal capital risk management. -
Additional Filters:
Consider adding trend strength indicators (such as ADX) or market structure indicators (such as support/resistance, key price levels) as additional confirmation layers to reduce trading in low-quality setups.
Summary
This "Multi-Indicator Dynamic Adaptive Quantitative Trading Strategy" represents a carefully designed quantitative trading approach that creates a comprehensive trading system by combining traditional technical analysis indicators with simulated AI confidence scoring. Its core strengths lie in multi-layered signal confirmation and dynamic risk management that adapts to market volatility.
The strategy is based on TEMA and KAMA crossovers, supplemented by MACD, RSI, and volume analysis confirmation, then finally filtered by an AI confidence score. This multi-layered approach helps reduce false signals but may also result in missing certain trading opportunities.
To further enhance strategy performance, implementing genuine machine learning models, market state adaptive adjustments, optimized stop mechanisms, and dynamic position management are recommended. These improvements can enhance the strategy's ability to handle different market environments, improving long-term stability and profit potential.
Importantly, any quantitative strategy requires comprehensive backtesting and forward testing before implementation, with particular attention to performance under different market conditions to ensure strategy robustness and adaptability. In actual trading, continuous monitoring and necessary adjustments are equally important to adapt to constantly changing market dynamics.
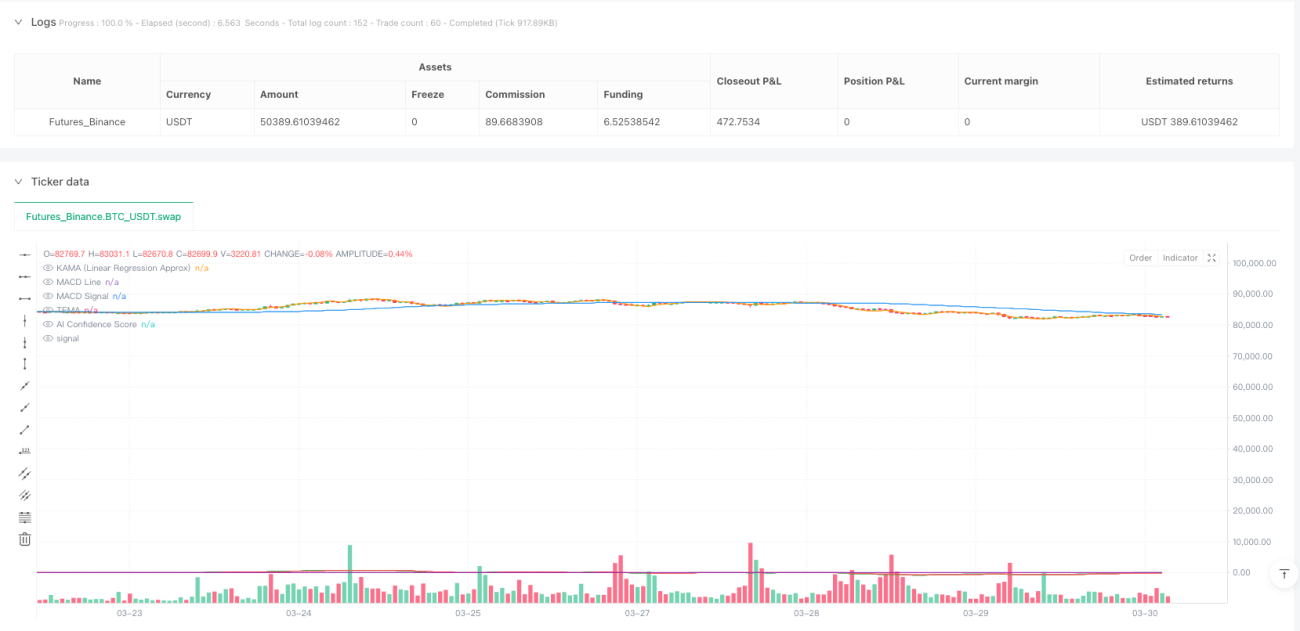
/*backtest
start: 2024-04-01 00:00:00
end: 2025-03-31 00:00:00
period: 1h
basePeriod: 1h
exchanges: [{"eid":"Futures_Binance","currency":"BTC_USDT"}]
*/

//@version=5
strategy("AI-Powered Crypto Strategy", overlay=true, default_qty_type=strategy.percent_of_equity, default_qty_value=10, calc_on_order_fills=true, calc_on_every_tick=true, slippage=1, commission_value=0.05)

// Parameters- 1